<< Chapter < Page Chapter >> Page >
Operation Counts for General Length FFT

Figures

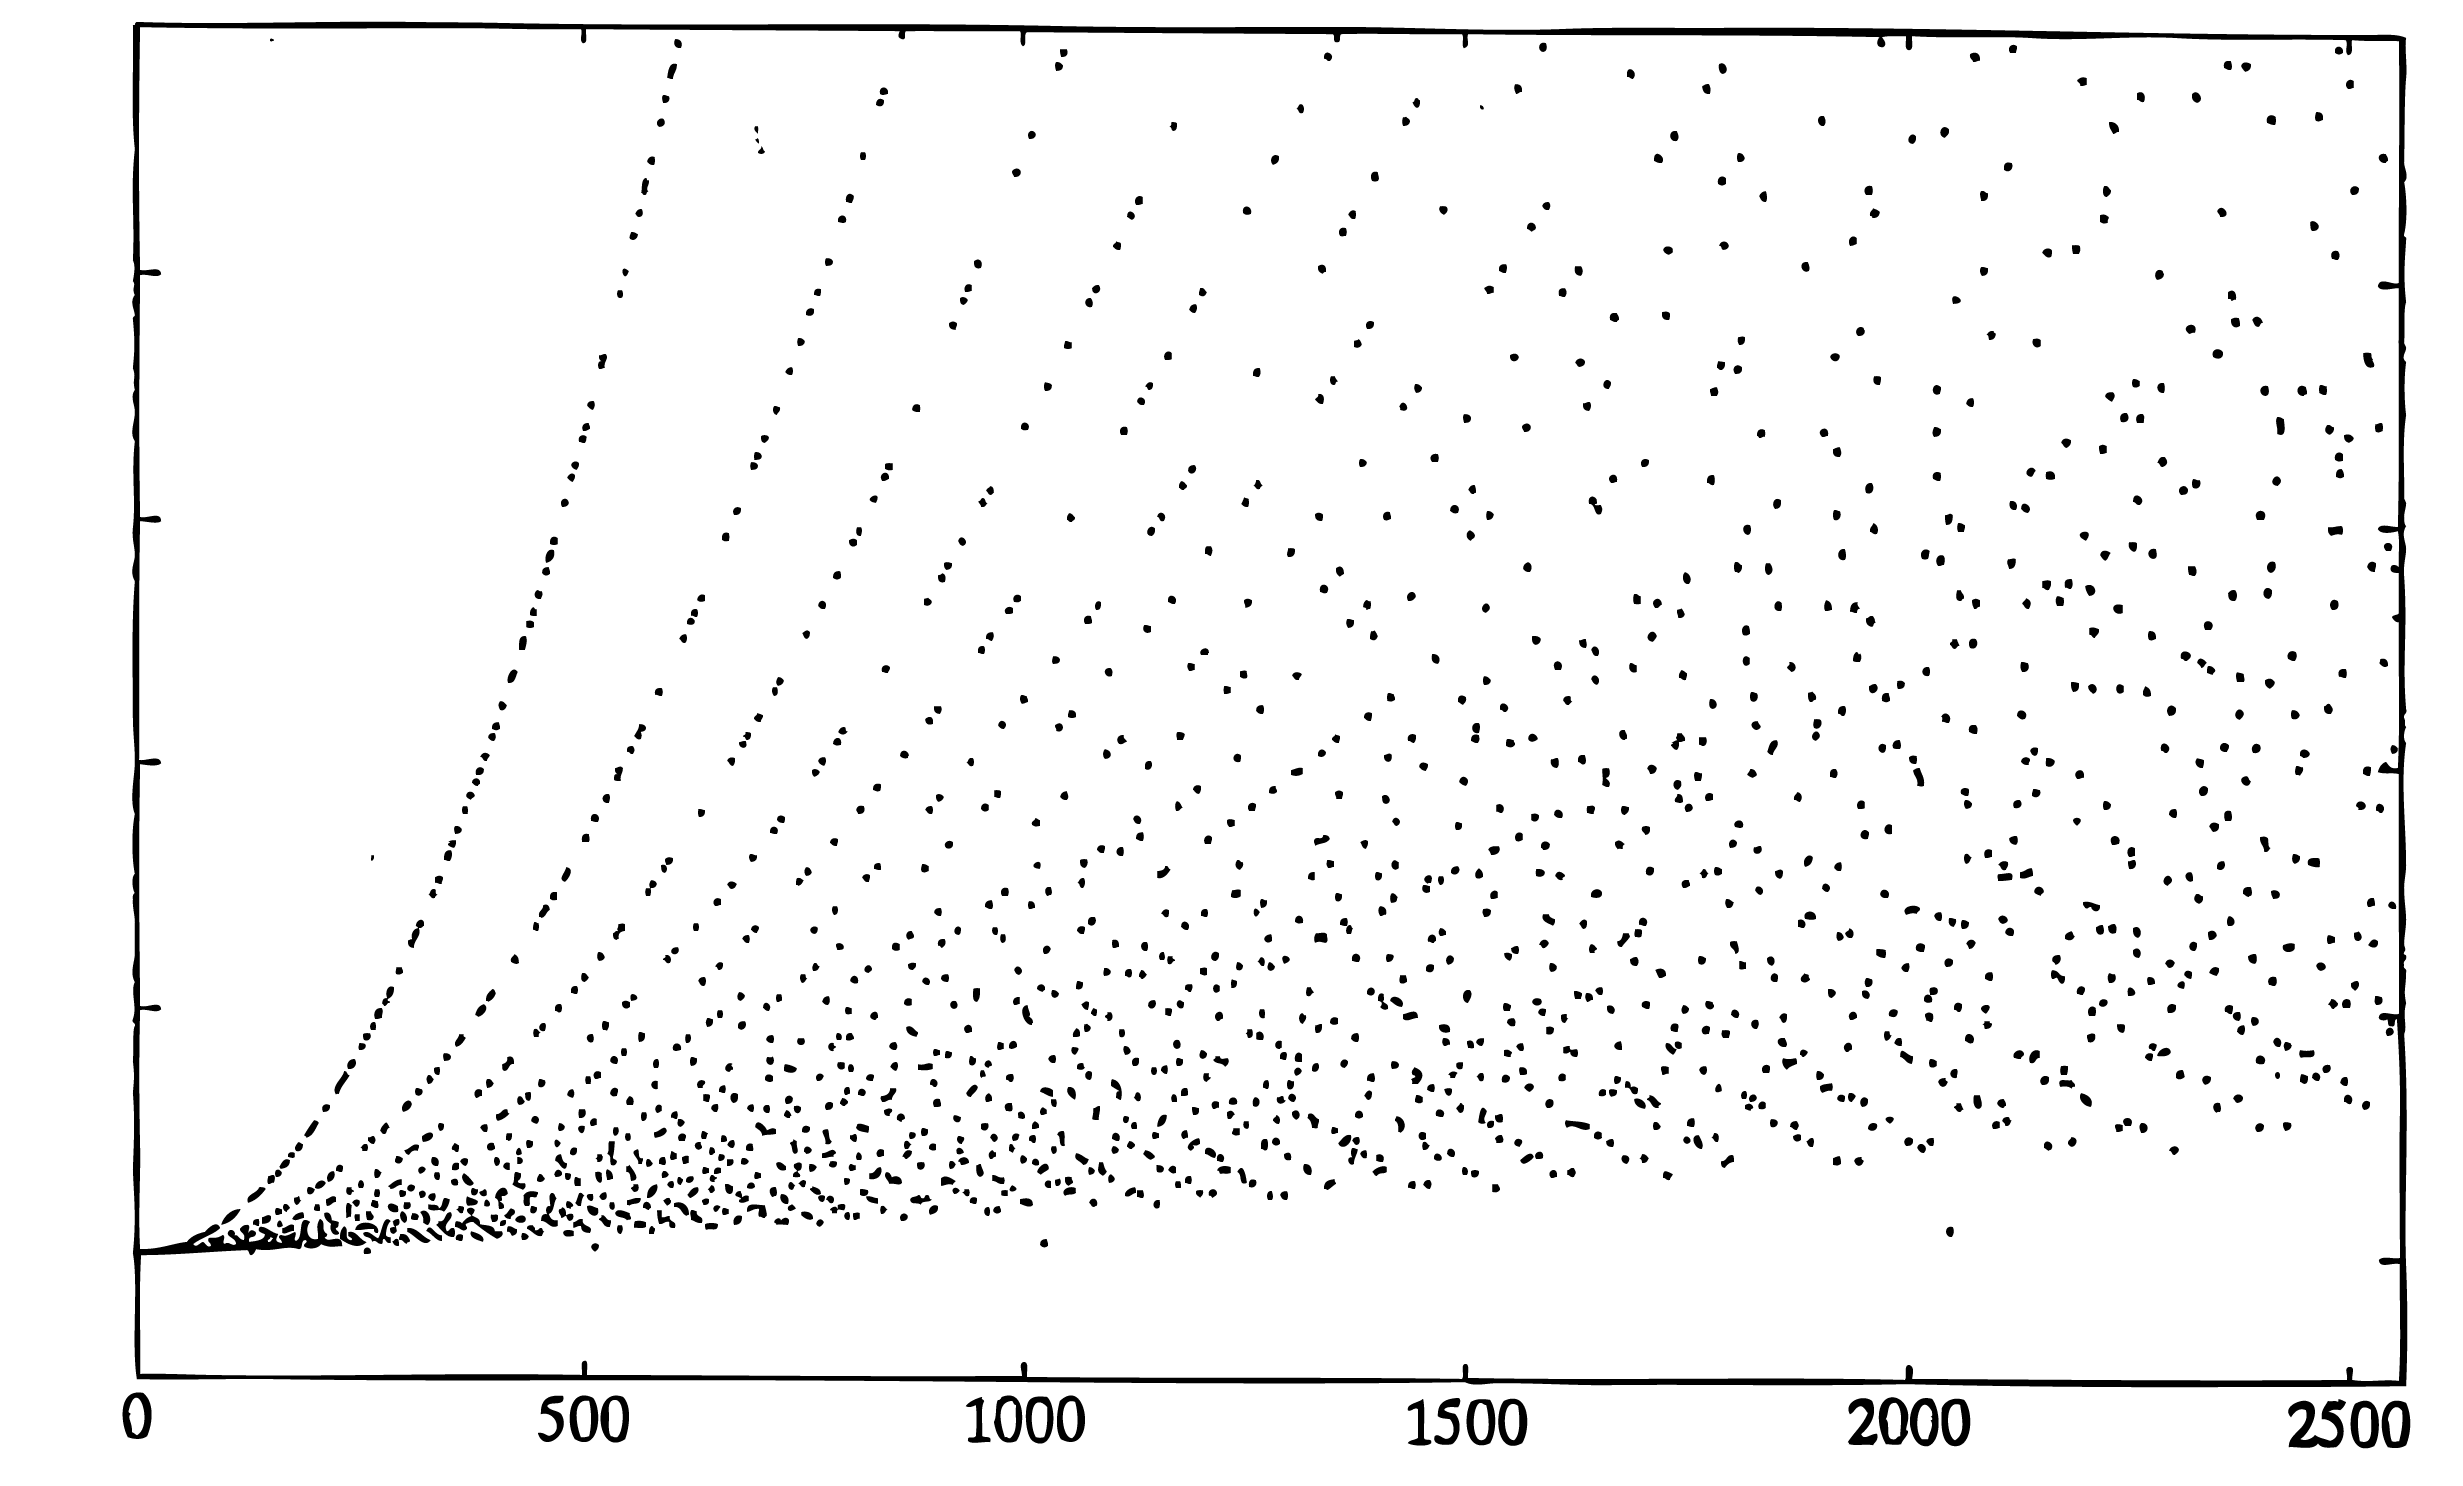
The Glassman-Ferguson FFT is a compact implementation of a mixed-radix Cooley-Tukey FFT with the short DFTs for each factor being calculated by a Goertzel-like algorithm. This means there are twiddle factor multiplications even when the factors are relatively prime, however, the indexing is simple and compact. It will calculate the DFT of a sequence of any length but is efficient only if the length is highly composite. The figures contain plots of the number of floating point multiplications plus additions vs. the length of the FFT. The numbers on the vertical axis have relative meaning but no absolute meaning.

This figure is a plot with an unlabeled vertical axis with eight incremental markings for reference and a horizontal axis ranging in value from 0 to 1000 in increments of 200. The graph contains a series of plotted dots that follow a clearly discernible pattern. From the first marking on the vertical axis and from 0 to approximately 100 on the horizontal axis, all dots are so close together that they form a nearly solid line. After this point, the dots spread out, and they strongly follow numerous curves. Each curve moves to the right and begins increasing at an increasing rate. A handful of curves increase in slope sharply so that they are separated from the rest, but the majority of the curves that do not increase quickly are so close together that they almost appear as just a jumbled mess of dots. The majority of the lines do not cross an imaginary vertical halfway point before they have terminated at the right side of the graph. This figure is a plot with an unlabeled vertical axis with eight incremental markings for reference and a horizontal axis ranging in value from 0 to 1000 in increments of 200. The graph contains a series of plotted dots that follow a clearly discernible pattern. From the first marking on the vertical axis and from 0 to approximately 100 on the horizontal axis, all dots are so close together that they form a nearly solid line. After this point, the dots spread out, and they strongly follow numerous curves. Each curve moves to the right and begins increasing at an increasing rate. A handful of curves increase in slope sharply so that they are separated from the rest, but the majority of the curves that do not increase quickly are so close together that they almost appear as just a jumbled mess of dots. The majority of the lines do not cross an imaginary vertical halfway point before they have terminated at the right side of the graph.
Flop-Count vs Length for the Glassman-Ferguson FFT

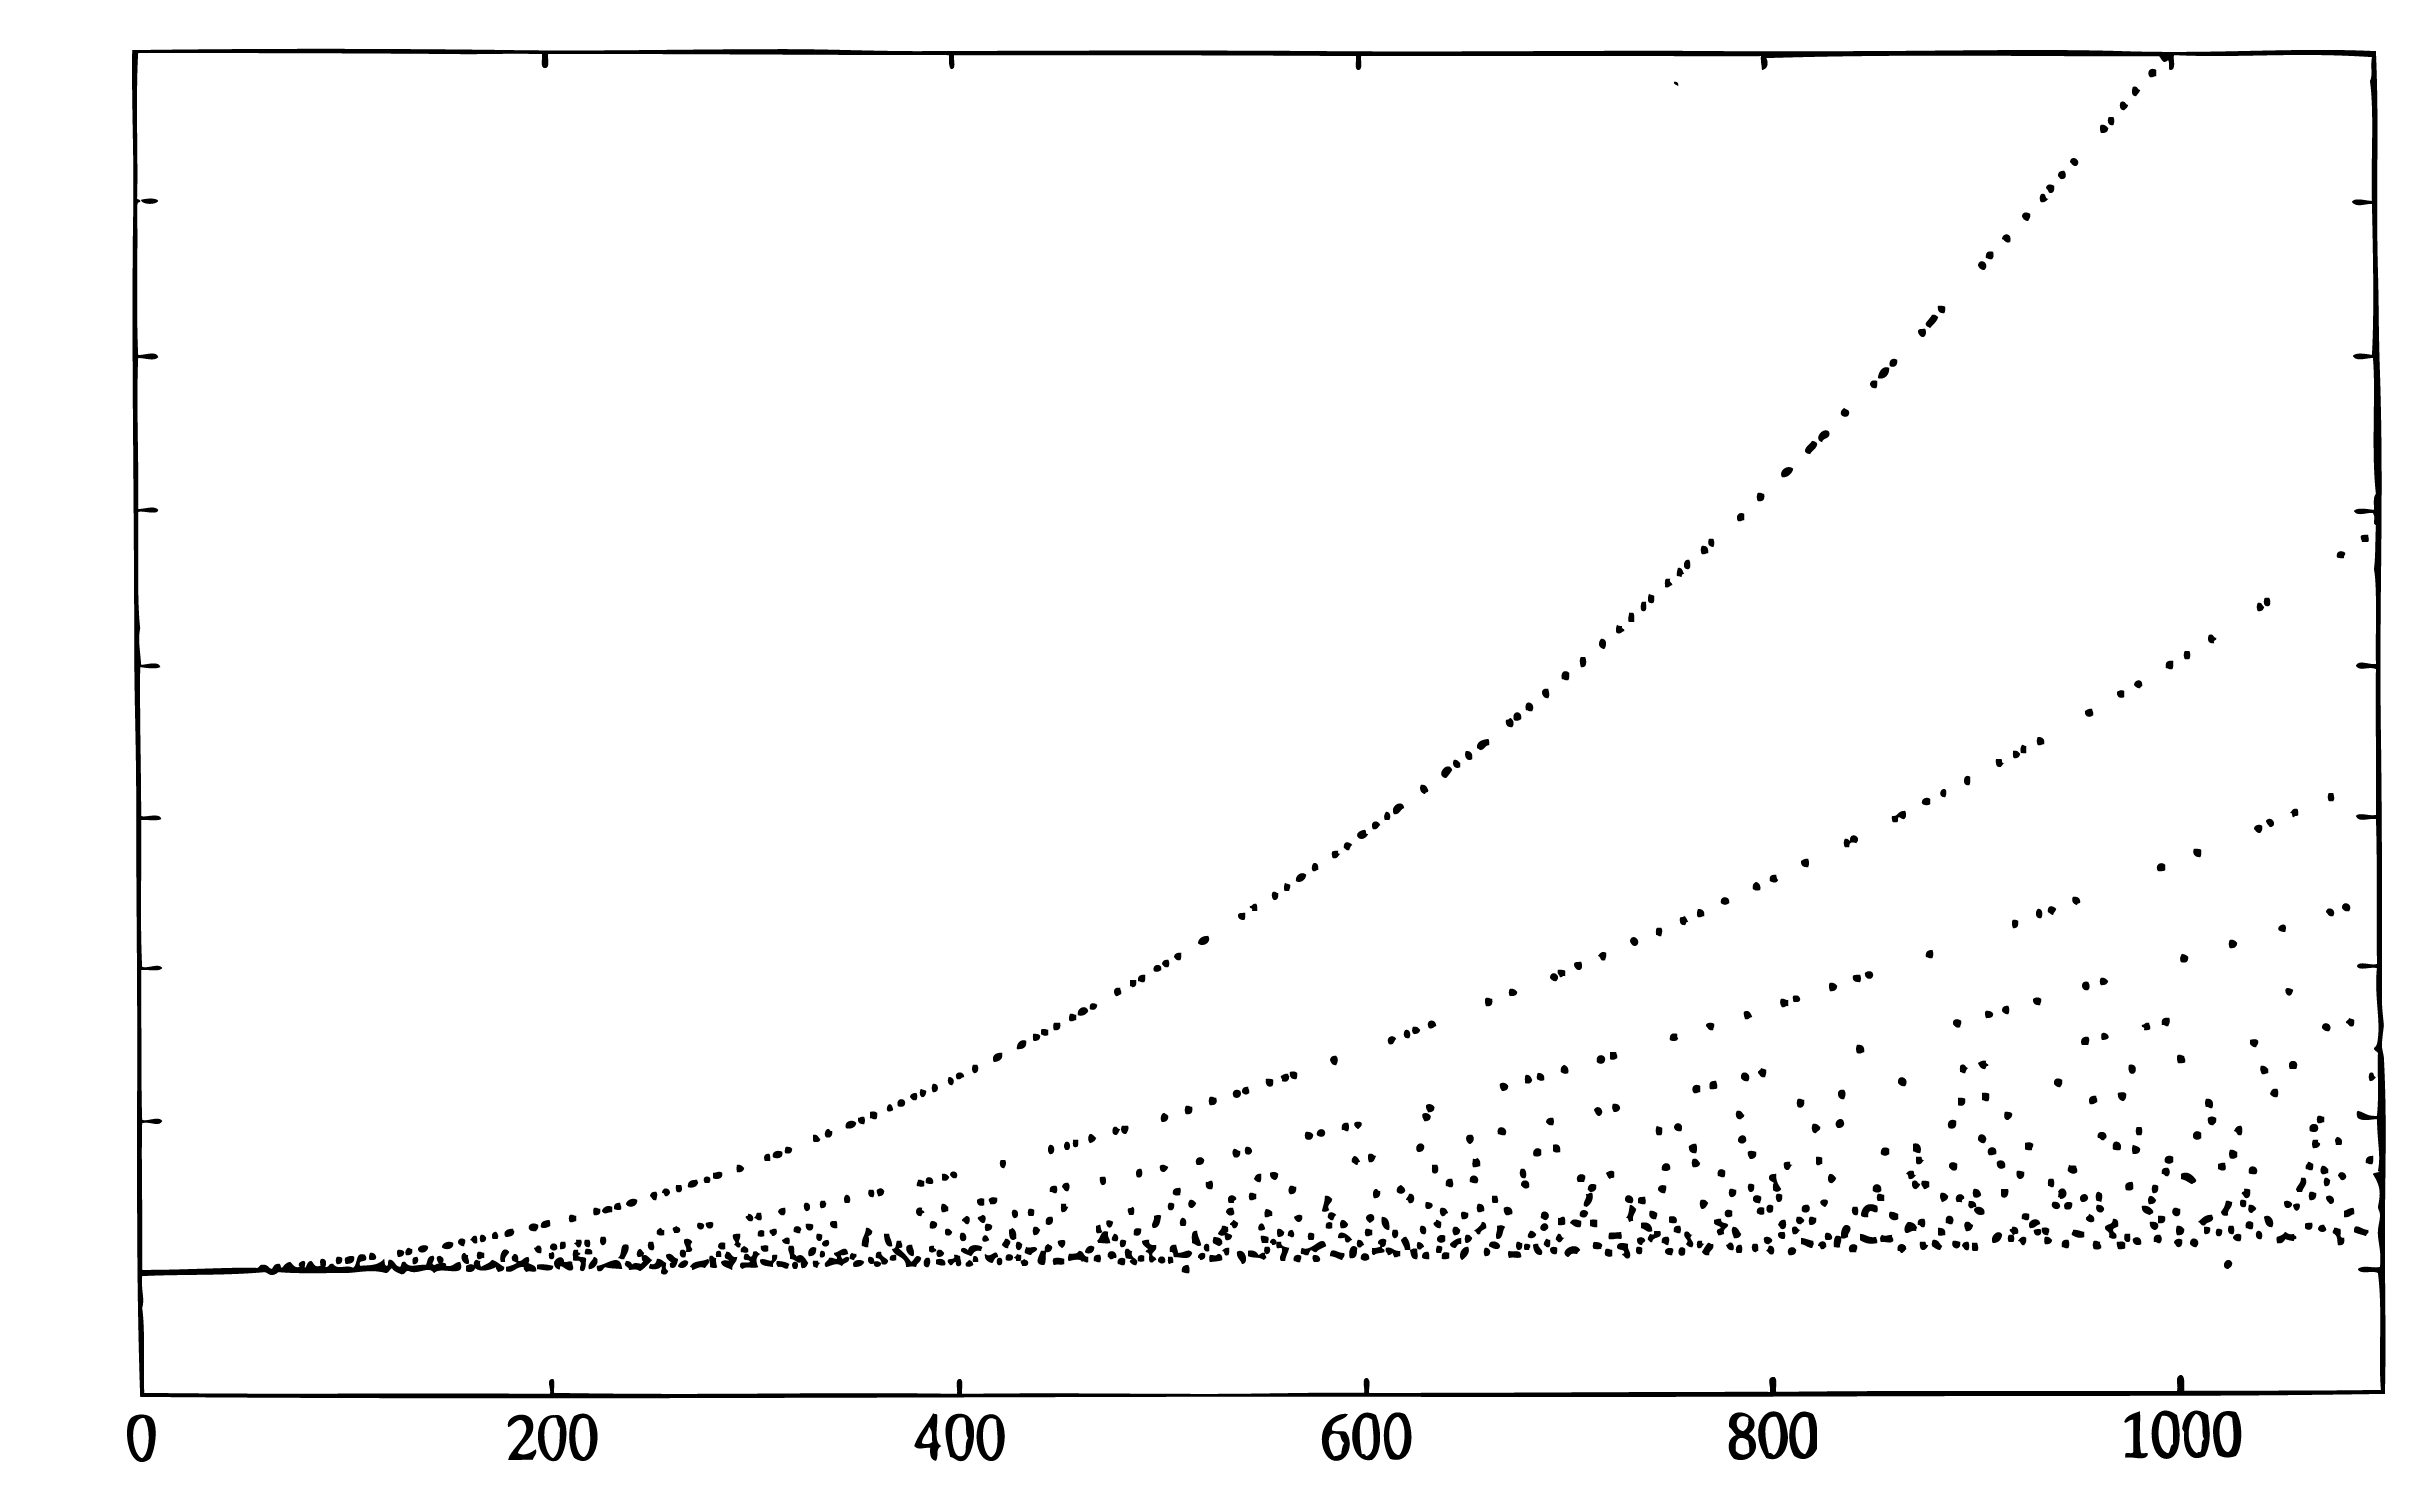
Note the parabolic shape of the curve for certain values. The upper curve is for prime lengths, the next one is for lengths that are two times a prime, and the next one is for lengths that are for three times a prime, etc. The shape of the lower boundary is roughly N log N. The program that generated these two figures used a Cooley-Tukey FFT if the length is two to a power which accounts for the points that are below the major lower boundary.

This figure is a plot with an unlabeled vertical axis with eight incremental markings for reference and a horizontal axis ranging in value from 0 to 1000 in increments of 200. The graph contains a series of plotted dots that follow a clearly discernible pattern. From the first marking on the vertical axis and from 0 to approximately 50 on the horizontal axis, all dots are so close together that they form a nearly solid line. After this point, the dots spread out, and they strongly follow numerous curves. Each curve moves to the right and begins increasing at an increasing rate. A handful of curves increase in slope sharply so that they are separated from the rest, but the majority of the curves that do not increase quickly are so close together that they almost appear as just a jumbled mess of dots. The majority of the lines cross an imaginary vertical halfway point before they have progressed horizontally three-fourths of the way across the graph. This figure is a plot with an unlabeled vertical axis with eight incremental markings for reference and a horizontal axis ranging in value from 0 to 1000 in increments of 200. The graph contains a series of plotted dots that follow a clearly discernible pattern. From the first marking on the vertical axis and from 0 to approximately 50 on the horizontal axis, all dots are so close together that they form a nearly solid line. After this point, the dots spread out, and they strongly follow numerous curves. Each curve moves to the right and begins increasing at an increasing rate. A handful of curves increase in slope sharply so that they are separated from the rest, but the majority of the curves that do not increase quickly are so close together that they almost appear as just a jumbled mess of dots. The majority of the lines cross an imaginary vertical halfway point before they have progressed horizontally three-fourths of the way across the graph.
Flop-Count vs Length for the Glassman-Ferguson FFT

Questions & Answers

what is phylogeny
Odigie Reply
evolutionary history and relationship of an organism or group of organisms
AI-Robot
ok
Deng
what is biology
Hajah Reply
the study of living organisms and their interactions with one another and their environments
AI-Robot
what is biology
Victoria Reply
HOW CAN MAN ORGAN FUNCTION
Alfred Reply
the diagram of the digestive system
Assiatu Reply
allimentary cannel
Ogenrwot
How does twins formed
William Reply
They formed in two ways first when one sperm and one egg are splited by mitosis or two sperm and two eggs join together
Oluwatobi
what is genetics
Josephine Reply
Genetics is the study of heredity
Misack
how does twins formed?
Misack
What is manual
Hassan Reply
discuss biological phenomenon and provide pieces of evidence to show that it was responsible for the formation of eukaryotic organelles
Joseph Reply
what is biology
Yousuf Reply
the study of living organisms and their interactions with one another and their environment.
Wine
discuss the biological phenomenon and provide pieces of evidence to show that it was responsible for the formation of eukaryotic organelles in an essay form
Joseph Reply
what is the blood cells
Shaker Reply
list any five characteristics of the blood cells
Shaker
lack electricity and its more savely than electronic microscope because its naturally by using of light
Abdullahi Reply
advantage of electronic microscope is easily and clearly while disadvantage is dangerous because its electronic. advantage of light microscope is savely and naturally by sun while disadvantage is not easily,means its not sharp and not clear
Abdullahi
cell theory state that every organisms composed of one or more cell,cell is the basic unit of life
Abdullahi
is like gone fail us
DENG
cells is the basic structure and functions of all living things
Ramadan
What is classification
ISCONT Reply
is organisms that are similar into groups called tara
Yamosa
in what situation (s) would be the use of a scanning electron microscope be ideal and why?
Kenna Reply
A scanning electron microscope (SEM) is ideal for situations requiring high-resolution imaging of surfaces. It is commonly used in materials science, biology, and geology to examine the topography and composition of samples at a nanoscale level. SEM is particularly useful for studying fine details,
Hilary
Got questions? Join the online conversation and get instant answers!
Jobilize.com Reply

Get Jobilize Job Search Mobile App in your pocket Now!

Get it on Google Play Download on the App Store Now


Source:  OpenStax, Fast fourier transforms. OpenStax CNX. Nov 18, 2012 Download for free at http://cnx.org/content/col10550/1.22
Google Play and the Google Play logo are trademarks of Google Inc.

Notification Switch

Would you like to follow the 'Fast fourier transforms' conversation and receive update notifications?

Ask