<< Chapter < Page Chapter >> Page >

Overview

Yesterday we learned about the “good” ozone layer high in the stratosphere that protects us from ultraviolet rays. However, ozone can also form near the surface of the Earth where we breathe. This ozone is a harmful air pollutant that can irritate our lungs. Today you will learn about how “bad” low-level ozone is created, its harmful effects, and how we can prevent its creation.

Can you remember a day when you could see that the air was polluted? Describe what you saw that indicated the air was polluted that day.

Ozone and some other air pollutants are invisible. Thus, you may not always be able to see if the air is polluted. The EPA’ Air Quality Index helps tell us how clean the air really is each day. We’ll learn more about the Air Quality Index later in this lesson.

Air pollution

Is all air pollution visible, or is some of it invisible?

What are some things that emit pollution into the air?

What are some effects of air pollution on humans and the environment?

What is the air quality index?

This Internet Activity will help us learn about the Air Quality Index. This index tells us about the quality of the air, even if air pollution is invisible.

  1. Type http://airnow.gov/index.cfm?action=aqikids.index into the address bar of the internet browser on your computer.
  2. Click on the cloud that says “What is the AQI?” Click “next” to read each section so you can answer all of the following questions.
  • What does the Air Quality Index measure?
  • What color means the best air quality?
  • What color means the worst air quality?

3. Now click on the link “Air Pollution&Health.” After you read each page, click “Next” to read the next page.
  • What health word goes with a “Green” AQI?
  • What does EPA recommend that active kids should do on a Red AQI (“Unhealthy”) day?

Ozone scavenger hunt

  1. Type http ://www.airnow.gov/ into the address bar of the internet browser on your computer.
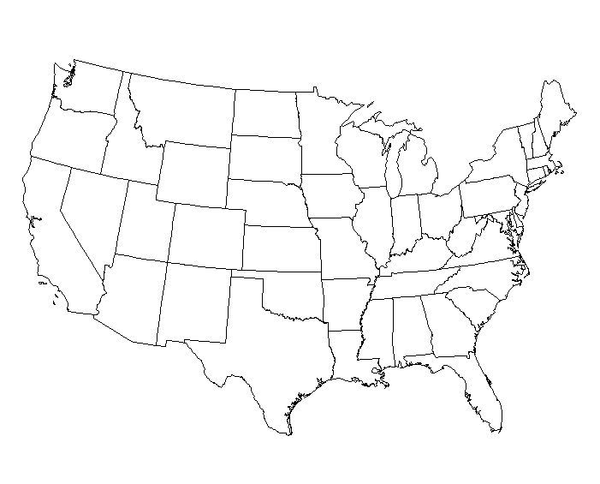
  2. Below the map on the homepage there is a link that says “Ozone Now”. Click on it. You should be able see the “Current Hour AQI.” How does it look? Are there any areas in the United States that look very badly polluted? Color the map as you see it:
  1. If you look below the map on the screen, you can watch an animation that shows how the Air Quality Index has changed over the course of the day. What time of day has the most green areas indicating clean air? What time of day has the most air pollution?
  2. Press the “Back” button to return to the homepage. Click on the map of the United States. Click on Texas. Scroll down until you see Houston-Galveston-Brazoria, TX.
  3. Look under the column “Current AQI.” What is the current AQI number for Houston-Galveston-Brazoria? What color does this correspond to? Is it safe to exercise outside?
  4. What is tomorrow’s forecast? What color does this correspond to? Will it be safe to exercise outside tomorrow?
  5. Click on Houston-Galveston-Brazoria, TX. Click on “yesterday’s summary” for ozone. Look at the Ozone: 1-hour Average Peak Concentration. What was the highest ozone concentration measured in the Houston region yesterday? Where did it happen?

Smog city 2

  1. Go to http://www.smogcity2.org/smogcity.cfm?preset=ozone in your internet browser.

Current emission factors and weather conditions are causing ground-level ozone in Smog City 2 to reach “Unhealthy” levels. The Air Quality Index (AQI) level for ozone is now Red. By following the scenarios below, see how emissions factors, temperature, and sunlight impact ozone levels. The weather factors that you will be able to change around are the following: clouds/sky cover, wind, and temperature. The emission factors that you will be able to change are the following: the amount of energy sources, cars and trucks, off-road vehicles, consumer products, and industries.

Scenario 1: Emissions Factors

Use only the emission controls to reduce the ozone levels to "Yellow" on the AQI, which is "Moderate" air quality. Do not change the weather controls.

  1. Which emission factor affects ozone the most?
  2. Which emission factor has the smallest effect on ozone?

Scenario 2: Weather Factors

Return all emission controls and population control to the middle. These conditions result in an "Unhealthy for Sensitive Groups" value, or "Orange" AQI.

  1. Increase temperature to 110F. How does the increase in temperature affect ozone levels?
  2. Now try increasing the cloud cover. How does the increase in cloud cover affect ozone levels?
  3. Now try increasing the wind speed. How does the increase in wind speed affect ozone levels?

Hypotheses

We saw in Smog City 2 how changes in meteorology caused ozone pollution to increase or decrease. Now let’s think about what patterns we expect to see in our daily ozone and meteorology measurements.

A hypothesis is an educated guess about the results that we expect to find in a scientific experiment. Even though we haven’t finished all of our outdoor measurements, we can make hypotheses about how we expect the ozone and meteorology measurements to be related.

Fill in the table below with your hypotheses about your ozone and meteorology measurements.

  1. Check “positive correlation” if you think that ozone concentrations will be higher on days when that meteorological measurement is high.
  2. Check “negative correlation” if you think that ozone concentrations will be lower on days when that meteorological measurement is high.
  3. Check “no correlation” if you think the measurements are not related.

We will evaluate our hypotheses when we analyze all of our measurements in Lesson 7.

Get Jobilize Job Search Mobile App in your pocket Now!

Get it on Google Play Download on the App Store Now


Source:  OpenStax, Rice air curriculum. OpenStax CNX. May 09, 2010 Download for free at http://cnx.org/content/col11200/1.1
Google Play and the Google Play logo are trademarks of Google Inc.

Notification Switch

Would you like to follow the 'Rice air curriculum' conversation and receive update notifications?

Ask