

| << Chapter < Page | Chapter >> Page > |

Next, the Levene’s Test of Equality of Error Variances table is examined. This table involves checking the assumption that the variability is consistent within each dependent variable for each cell in the research design. The Sig. value in each row must be greater than .05 for each assumption to be met. In the table below, the assumption of equality of error variances is met for all four dependent variables as the Sig. values range from .249 to .651. Readers should be informed that this assumption for each dependent variable was met or was not met. See Field (2010) for a detailed discussion regarding Levene’s Test and the robustness of MANOVA, even when this assumption is violated.

Underneath the Levene’s Test of Equality table is the Tests of Between-Subjects Effects table. Contained in this table are the univariate ANOVAs regarding whether the reading groups differ on each of the four dependent variables. The Wilks’ Lambda simply indicated whether an overall difference across the aggregated dependent variables was present. It did not provide information on whether the difference was for one, two, three, or all four of the dependent variables.

Find the row section that begins with the name of the independent variable. In our case, the independent variable is labeled group. Each row in this group section is a separate analysis of variance result. Examining the Sig. column for our four rows shows that each univariate ANOVA yielded a statistically significant result.
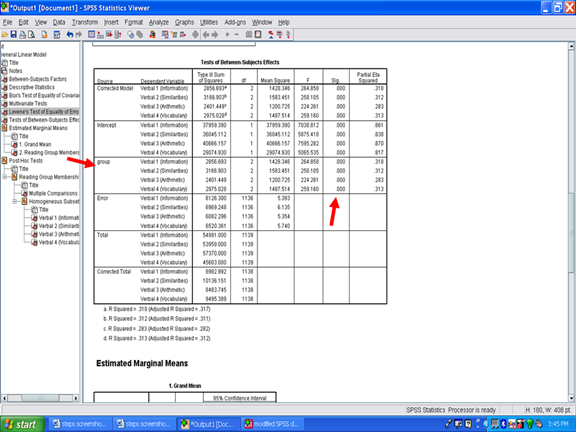
These results may be interpreted to mean that a statistically significant difference was present for Verbal 1, for Verbal 1, for Verbal 3, and for Verbal 4 as a function of the reading group. The effect size information for each statistically significant difference is present in the last column, the one labeled Partial Eta Squared. Partial eta squared, or n 2 , is the effect size metric provided to you in the SPSS output. To interpret whether it is small, moderate, or large, see Cohen (1988).

Because a statistically significant difference is present for each dependent variable, post hoc procedures must be examined to determine if all groups differ from each other or if only some of the groups differ. Post hoc procedure information is provided in the Multiple Comparisons table. The arrow below is pointed toward the specific type of post hoc we requested.

The most important column in this post hoc table is the Sig. column. For a pairwise comparison to be statistically significant, the Sig. value must be .05 or below. In the example below for the Verbal 1 set of comparisons, Excellent Readers did not differ from Good Readers, however, Excellent readers did differ from Extremely Poor Readers.

Readers should note that only three pairwise comparisons are unique in the table for each dependent variable. SPSS, however, provides information on six pairwise comparisons. When three groups are present, as they are in this example, row 1, row 2, and row 4 are unique. Row 1 is Excellent Reader compared to Good Reader. Row 2 is Excellent Reader compared to Extremely Poor Reader. Row 4 is Good Reader compared to Extremely Poor Reader.

Each of the four dependent variables in this example have post hoc procedures calculated for them and are present in the table above.
All of the useful information present in the SPSS output for the MANOVA procedure has now been covered.
Notification Switch
Would you like to follow the 'Calculating advanced statistics' conversation and receive update notifications?

|
|

|
|

|
|

|
|

|
|

|
|

|
|

|
|

|
|

|