

| << Chapter < Page | Chapter >> Page > |
The following code draws eye diagrams for the pulse
shapes defined by the variable
ps . As in the pulse shaping
programs of the previous section, the
N binary
data points are oversampled by a factor of
M and the convolution of the pulse shapes with
the data uses the
filter command.
The
reshape(x,a,b) command
changes a vector
x of size
a*b into a matrix
with
a rows and
b columns, which is used to
segment
x into
b overlays, each
a samples long. This works smoothly with the M
atlab
plot function.
N=1000; m=pam(N,2,1);                   % random signal of length N
M=20; mup=zeros(1,N*M); mup(1:M:N*M)=m; % oversampling by factor of Mps=hamming(M);                          % hamming pulse of width M
x=filter(ps,1,mup);                     % convolve pulse shape with mupneye=5; c=floor(length(x)/(neye*M));    % number of eyes to plot
xp=x(end-neye*M*c+1:end);               % dont plot transients at startplot(reshape(xp,neye*M,c))              % overlay in groups of size neye

eyediag.m  plot eye diagrams for a pulse shape
(download file)
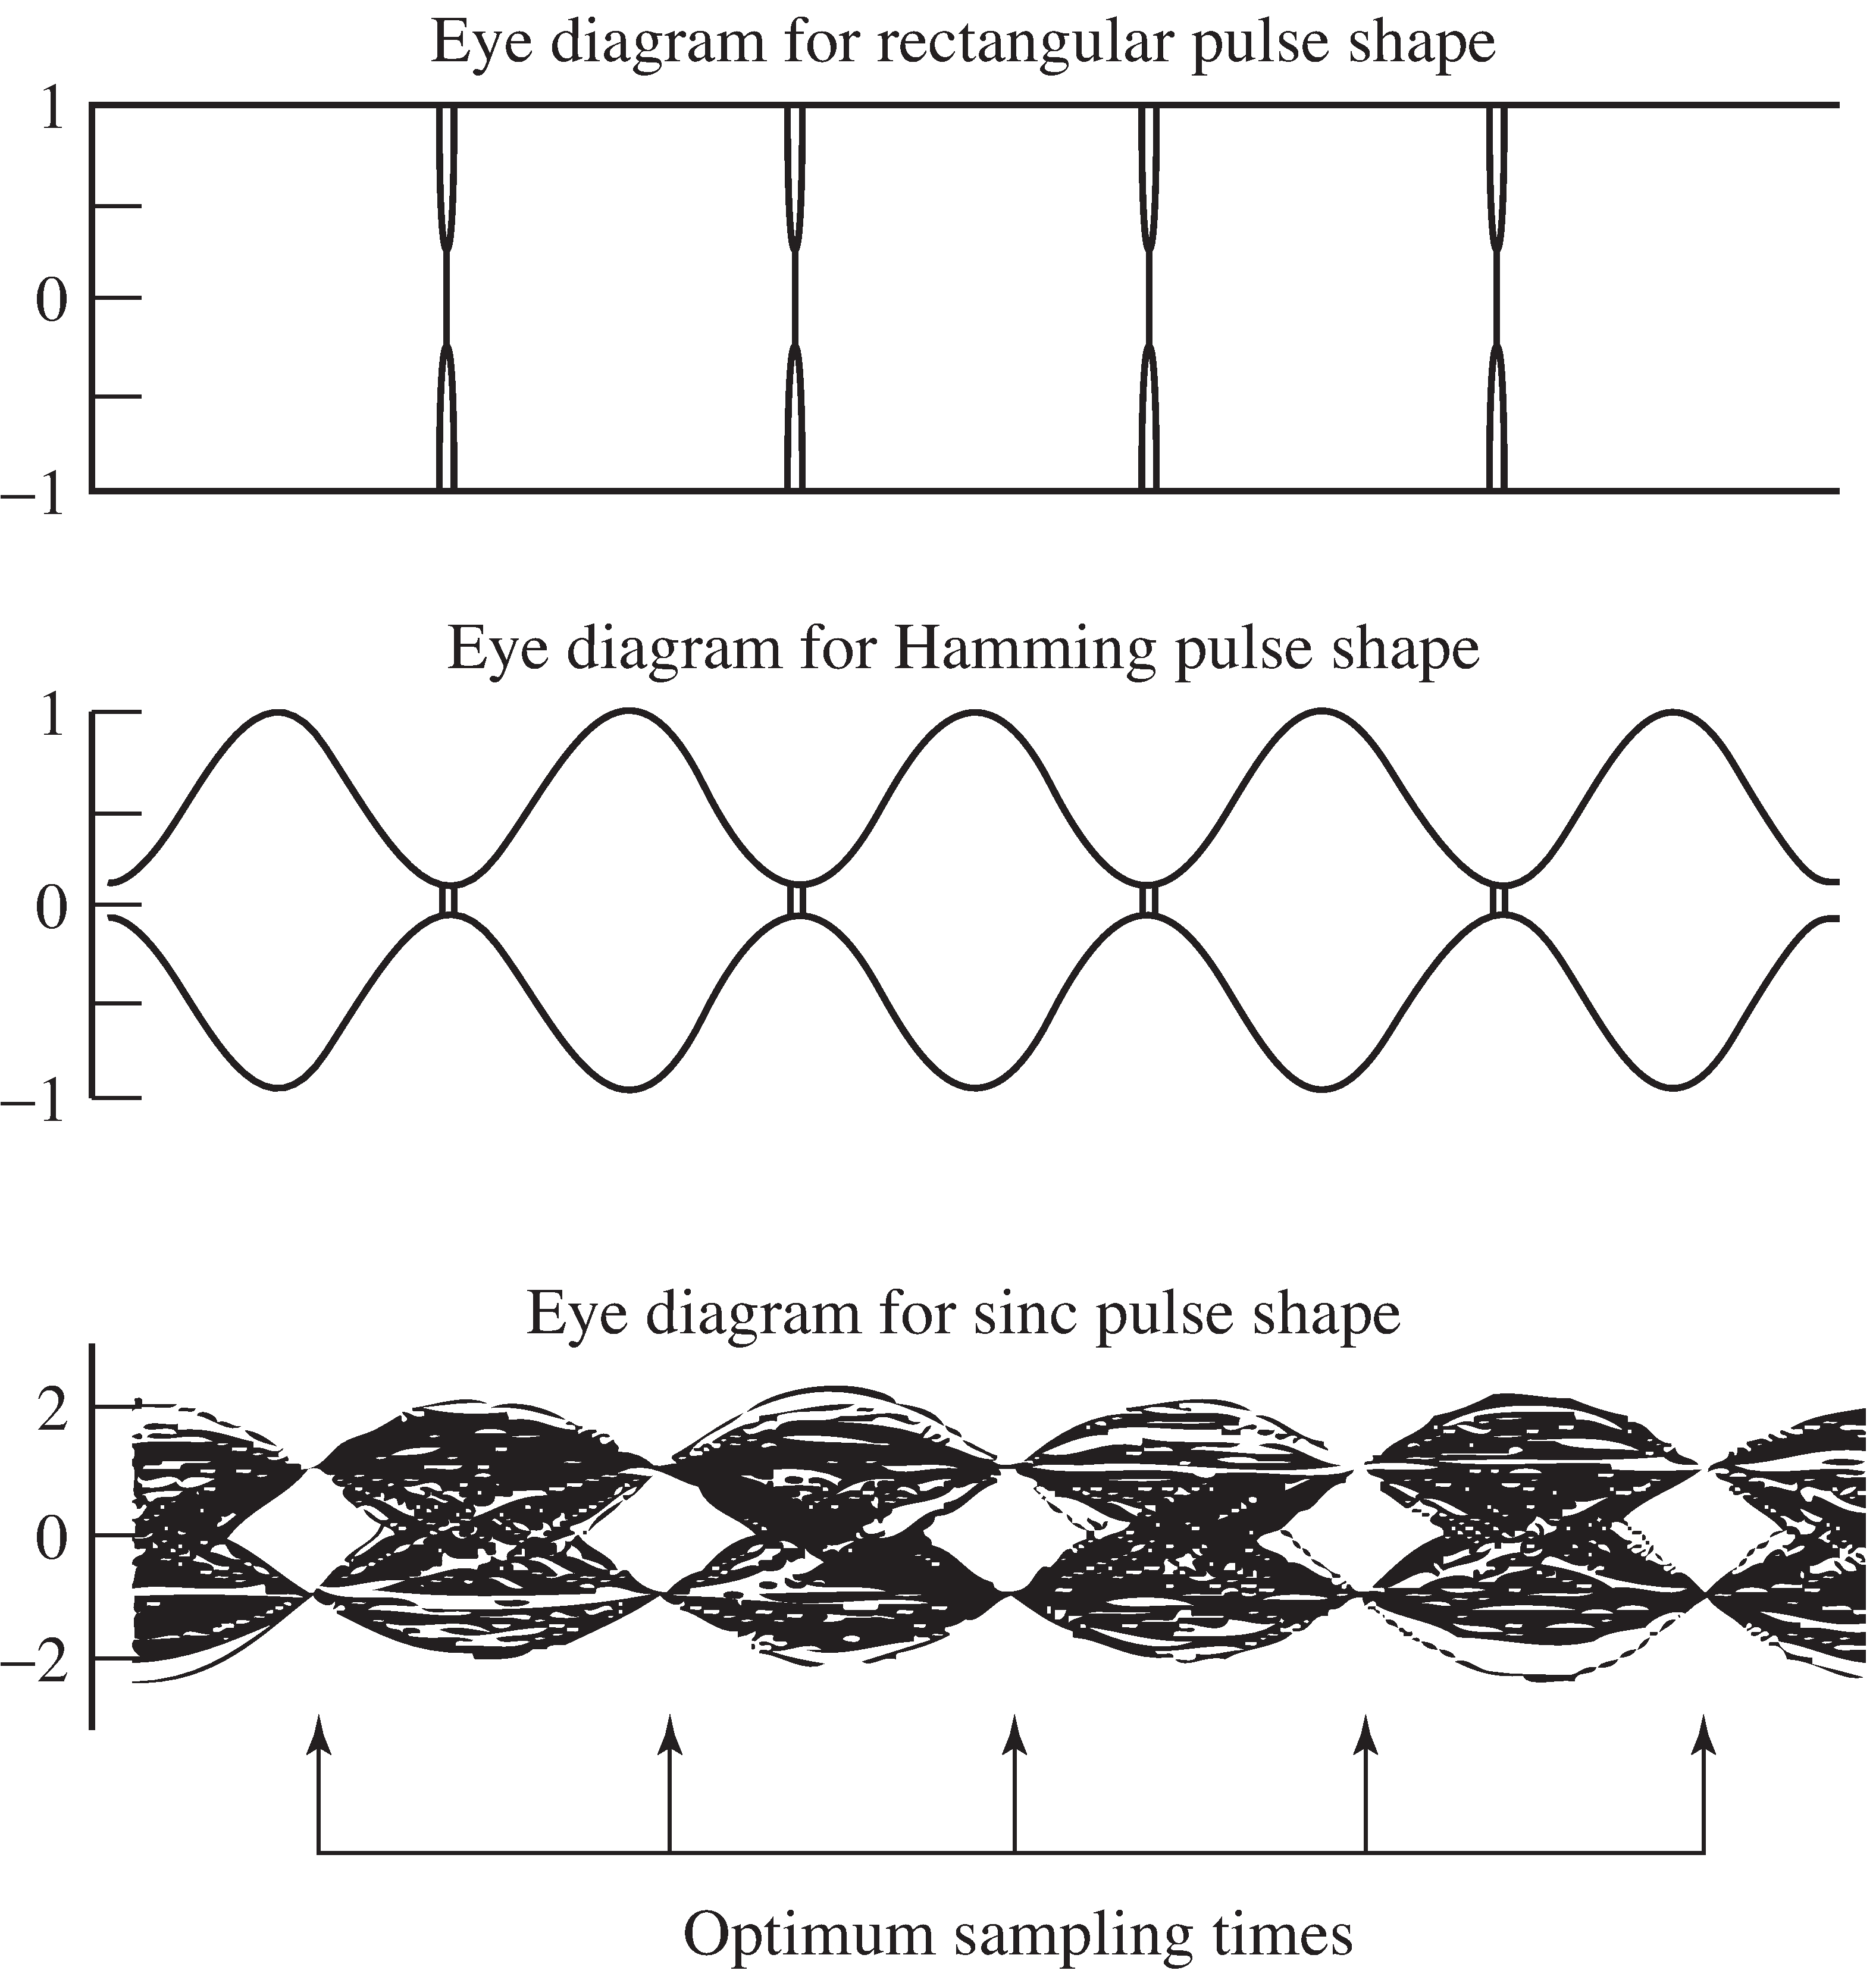
Typical output of
eyediag.m is shown in
[link] . The rectangular pulse shape
in the top plot uses
ps=ones(1,M) , the Hamming
pulse shape in the middle uses
ps=hamming(M) ,
and the bottom plot uses atruncated sinc pulse shape
ps=srrc(L,0,M) for
L=10 that is normalized
so that the largest value is one.The rectangular pulse is insensitive to
timing errors, since sampling almost anywhere(except right at the transition boundaries) will return the
correct values. The Hamming pulse shape has a wide eye,but may suffer from a loss of SNR if the samples are taken
far from the center of the eye.Of the three, the sinc pulse is the most sensitive,
since it must be sampled nearthe correct instants or erroneous values will result.
Modify
eyediag.m so that the data sequence is drawn from the alphabet
,
,
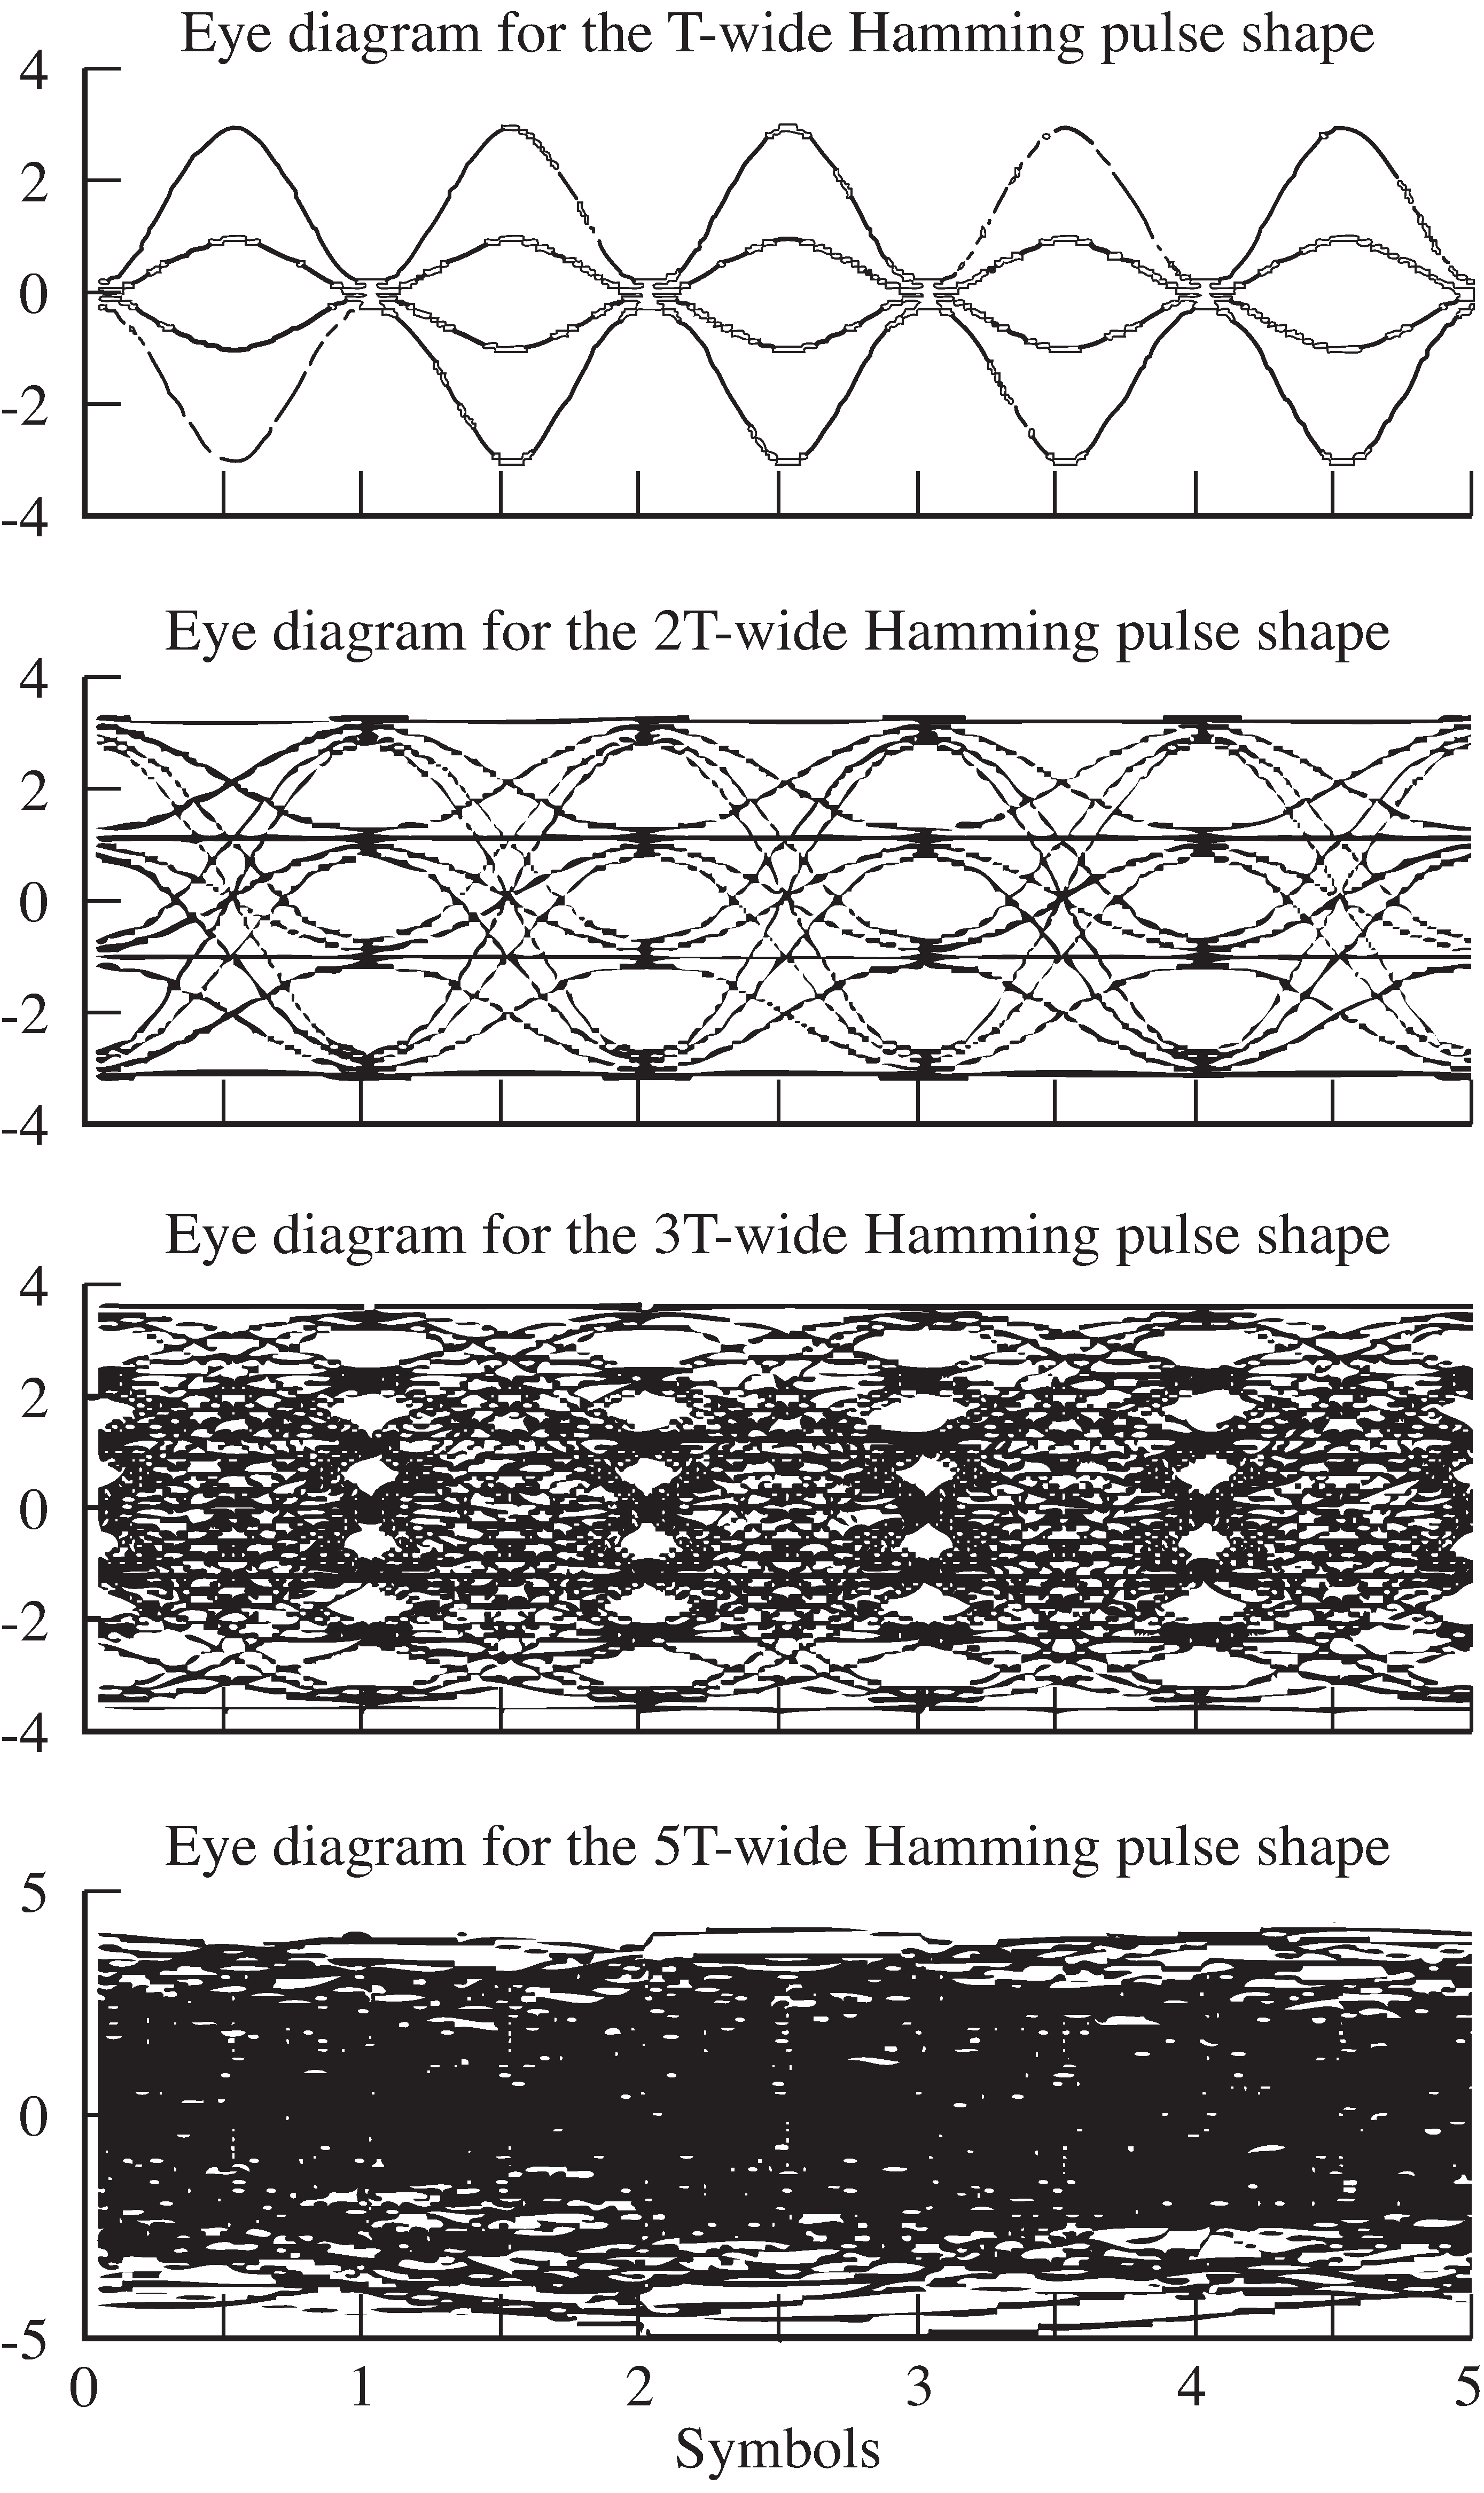
. Draw the appropriate eye diagram
for the rectangular, Hamming,and sinc pulse shapes.
Modify
eyediag.m to add noise to the pulse shaped signal
x .
Use the M
atlab command
v*randn for different values of
v .
Draw the appropriate eye diagrams. For each pulse shape,how large can
v be and still have the eye remain open?
TRUE or FALSE: For two rectangular impulse responses with the same maximummagnitude but different time widths with , the half-power bandwidth of the frequency response of thepulse with width exceeds that of the pulse with width .
TRUE or FALSE: For the PAM baseband signals created bya rectangular pulse and a triangular pulse with the same time width and the same maximum amplitude,the half-power bandwidth of the sequence using the triangular pulse exceeds that of the rectangular pulse.
Notification Switch
Would you like to follow the 'Software receiver design' conversation and receive update notifications?

|
|

|
|

|
|

|
|

|
|

|
|
|
|
|
|
|
|

|
|

|