

| << Chapter < Page | Chapter >> Page > |
√ Move over the dependent variables. In this example, highlight each of the dependent variables one at a time and click on the right arrow.

When all four dependent variables are in the Variable cell, then click on Statistics.

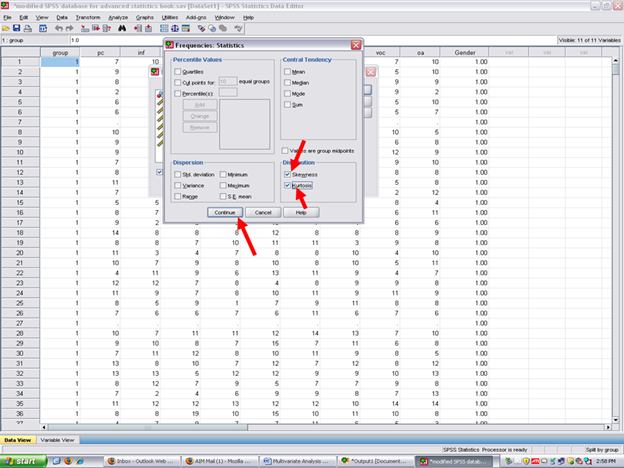
After clicking on statistics, the screen below will appear. Note that no statistics items are checked. For purposes of this example, only the skewness and kurtosis items will be checked. Although readers may obtain descriptive statistics at this screen, the MANOVA procedure itself can be used to obtain that information.

Though previously discussed in the steps and screenshots chapters for the basic statistical procedures, readers may find the following information helpful in understanding skewness and kurtosis and their importance for conducting statistical procedures.
* Skewness [Note. Skewness refers to the extent to which the data are normally distributed around the mean. Skewed data involve having either mostly high scores with a few low ones or having mostly low scores with a few high ones.] Readers are referred to the following sources for a more detailed definition of skewness: (External Link)&term_id=356 and (External Link)
To standardize the skewness value so that its value can be constant across datasets and across studies, the following calculation must be made: Take the skewness value from the SPSS output and divide it by the Std. error of skewness. If the resulting calculation is within -3 to +3, then the skewness of the dataset is within the range of normality (Onwuegbuzie&Daniel, 2002). If the resulting calculation is outside of this +/-3 range, the dataset is not normally distributed.
* Kurtosis [Note. Kurtosis also refers to the extent to which the data are normally distributed around the mean. This time, the data are piled up higher than normal around the mean or piled up higher than normal at the ends of the distribution.] Readers are referred to the following sources for a more detailed definition of kurtosis: (External Link)&term_id=326 and (External Link)
To standardize the kurtosis value so that its value can be constant across datasets and across studies, the following calculation must be made: Take the kurtosis value from the SPSS output and divide it by the Std. error of kurtosis. If the resulting calculation is within -3 to +3, then the kurtosis of the dataset is within the range of normality (Onwuegbuzie&Daniel, 2002). If the resulting calculation is outside of this +/-3 range, the dataset is not normally distributed. Then the kurtosis of the dataset is within the range of normality (Onwuegbuzie&Daniel, 2002). If the resulting calculation is outside of this +/-3 range, the dataset is not normally distributed.
Click on Skewness, Kurtosis, and Continue
Now click on OK.

If SPSS does not send you to the Output screen, click on the Output button at the bottom of your screen so that you can view the results of the statistics you just had SPSS calculate for you.

Clicking on the Output icon will result in the screen below being present. You will note that the Statistics table below contains statistics for the Excellent Reader group; for the Good Reader group; and for the Extremely Poor Reader group.

In the columns to the right of the three reading groups are the skewness and kurtosis values for the four dependent variables.

Using the skewness and kurtosis value for each dependent variable above for each of the three groups above, type them in one at a time into the standardized coefficients calculator. To be regarded as being normally distributed, the coefficient should be within -3 to +3 (Onwuegbuzie&Daniel, 2002).

After calculating the standardized coefficients, record the number that are within +/-3 and the number that are outside of these boundaries. This information needs to be discussed in your results section where you document your checks of the assumptions underlying this particular statistical technique.
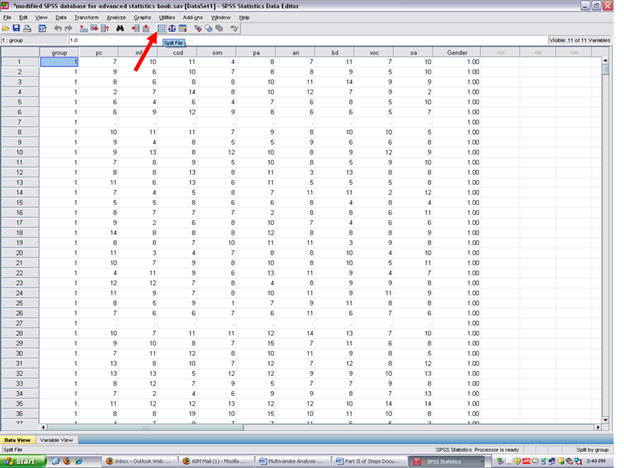
Now, before conducting the MANOVA to answer our research question, this dataset must be put back together. Remember that the dataset is currently split. As you were in the SPSS Output screen, make sure that you go back to the Data screen before continuing.
To unsplit the file,
√ Split Files (the icon next to the scales)
Clicking on split files will reveal this screen. Although two ways exist in which to have SPSS analyze all cases, the easiest is simply to click on:
√ Analyze all cases, do not create groups
Then, √ OK

After clicking on OK, your screen should now look like the one below.

Notification Switch
Would you like to follow the 'Calculating advanced statistics' conversation and receive update notifications?

|
|

|
|

|
|

|
|

|
|

|
|

|
|

|
|
|
|
|

|