

| << Chapter < Page | Chapter >> Page > |
For this particular chapter, the research question on which we will conduct a MANOVA will be: What is the difference in verbal aptitude among elementary reading groups? Verbal aptitude consists of Verbal 1 (inf), Verbal 2 (sim), Verbal 3 (ari), and Verbal 4 (voc).

In this example, our independent or grouping variable is elementary reading group.

By clicking on variable view, you can see how many groups of students are present in the reading group variable; the names of the groups; and the numbers which have been assigned to each group.
After clicking on Variable View, the following screen will appear: Arrows have been placed toward the name of the independent or grouping variable; toward the label assigned to this variable; and then toward the values of each group.

Now click on the cell for Reading Group Membership. Three dots will appear, indicating that another screen is beneath this one.

Click on the three dots shown in the screen above and the value and name of each of the reading groups will be shown. Our three groups are Excellent Reader (1), Good Reader (2), and Extremely Poor Reader (3).

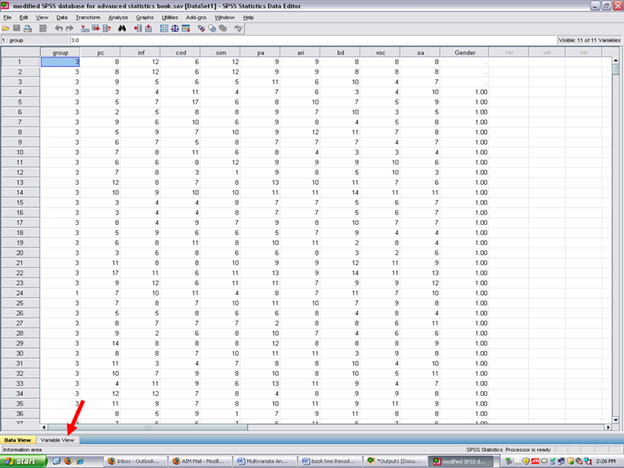
Now that you know what your independent (grouping) variable is and your dependent variables are, it is time to determine the extent to which the dependent variable data are normally distributed. Cancel out of the screen above. Then click on data view.

Your screen should now look like the one below.

Check for Skewness and Kurtosis values falling within/without the parameters of normality (-3 to +3). To do so, you need to obtain these values for each of your three groups for each of your four dependent variables.
√ Split your file on the basis on your independent variable/fixed factor/grouping variable. To do so, click on the icon next to the scales. Holding your cursor on it will reveal Split File, as shown below.

After clicking on the split file icon, the following screen will appear: You will note that the Analyze all cases, do not create groups is checked. This value is the default for SPSS as all cases are analyzed, unless otherwise specified. To obtain measures of normality for each of the three reading groups, the Compare groups button will need to be clicked.

The screen below will appear after the Compare groups button has been clicked. Note that the Groups Based on rectangle has now become active. The independent (grouping) variable should be highlighted, as it already is, and then moved to the Groups Based on cell. After highlighting the Reading Group Membership variable, then click on the arrow below.

After clicking on the arrow, your independent variable of Reading Group Membership is now in the Groups Based on cell. Now click on OK.

Now all SPSS analyses will be calculated separately for each of the three reading groups.

√ Analyze
* Descriptive Statistics
* Frequencies

After clicking on frequencies, the following screen should now be present. Remember that the dependent variables in this example are Verbal 1 through Verbal 4 (i.e., inf, ari, voc)

Notification Switch
Would you like to follow the 'Calculating advanced statistics' conversation and receive update notifications?

|
|

|
|

|
|

|
|

|
|

|
|

|
|

|
|

|
|

|