

| << Chapter < Page | Chapter >> Page > |
| Boys from Birth to 36 Months | Girls from Birth to 36 Months | ||
|---|---|---|---|
| Length (inches) | Weight (pounds) | Length (inches) | Weight (pounds) |
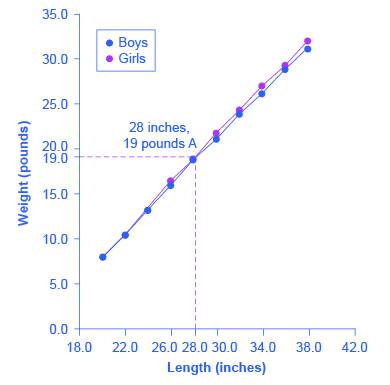
| 20.0 | 8.0 | 20.0 | 7.9 |
| 22.0 | 10.5 | 22.0 | 10.5 |
| 24.0 | 13.5 | 24.0 | 13.2 |
| 26.0 | 16.4 | 26.0 | 16.0 |
| 28.0 | 19.0 | 28.0 | 18.8 |
| 30.0 | 21.8 | 30.0 | 21.2 |
| 32.0 | 24.3 | 32.0 | 24.0 |
| 34.0 | 27.0 | 34.0 | 26.2 |
| 36.0 | 29.3 | 36.0 | 28.9 |
| 38.0 | 32.0 | 38.0 | 31.3 |
Not all relationships in economics are linear. Sometimes they are curves. [link] presents another example of a line graph, representing the data from [link] . In this case, the line graph shows how thin the air becomes when you climb a mountain. The horizontal axis of the figure shows altitude, measured in meters above sea level. The vertical axis measures the density of the air at each altitude. Air density is measured by the weight of the air in a cubic meter of space (that is, a box measuring one meter in height, width, and depth). As the graph shows, air pressure is heaviest at ground level and becomes lighter as you climb. [link] shows that a cubic meter of air at an altitude of 500 meters weighs approximately one kilogram (about 2.2 pounds). However, as the altitude increases, air density decreases. A cubic meter of air at the top of Mount Everest, at about 8,828 meters, would weigh only 0.023 kilograms. The thin air at high altitudes explains why many mountain climbers need to use oxygen tanks as they reach the top of a mountain.

| Altitude (meters) | Air Density (kg/cubic meters) |
|---|---|
| 0 | 1.200 |
| 500 | 1.093 |
| 1,000 | 0.831 |
| 1,500 | 0.678 |
| 2,000 | 0.569 |
| 2,500 | 0.484 |
| 3,000 | 0.415 |
| 3,500 | 0.357 |
| 4,000 | 0.307 |
| 4,500 | 0.231 |
| 5,000 | 0.182 |
| 5,500 | 0.142 |
| 6,000 | 0.100 |
| 6,500 | 0.085 |
| 7,000 | 0.066 |
| 7,500 | 0.051 |
| 8,000 | 0.041 |
| 8,500 | 0.025 |
| 9,000 | 0.022 |
| 9,500 | 0.019 |
| 10,000 | 0.014 |
The length-weight relationship and the altitude-air density relationships in these two figures represent averages. If you were to collect actual data on air pressure at different altitudes, the same altitude in different geographic locations will have slightly different air density, depending on factors like how far you are from the equator, local weather conditions, and the humidity in the air. Similarly, in measuring the height and weight of children for the previous line graph, children of a particular height would have a range of different weights, some above average and some below. In the real world, this sort of variation in data is common. The task of a researcher is to organize that data in a way that helps to understand typical patterns. The study of statistics, especially when combined with computer statistics and spreadsheet programs, is a great help in organizing this kind of data, plotting line graphs, and looking for typical underlying relationships. For most economics and social science majors, a statistics course will be required at some point.
Notification Switch
Would you like to follow the 'Principles of economics' conversation and receive update notifications?

|
|
|
|
|

|
|

|
|
|
|
|

|
|

|
|

|
|

|
|

|
|

|
|

|