<< Chapter < Page Chapter >> Page >

Of course, economic models express relationships using economic variables, like Budget = money_spent_on_econ_books + money_spent_on_music, assuming that the only things you buy are economics books and music.

Most of the relationships we use in this course are expressed as linear equations of the form:

y = b + mx

Expressing Equations Graphically

Graphs are useful for two purposes. The first is to express equations visually, and the second is to display statistics or data. This section will discuss expressing equations visually.

To a mathematician or an economist, a variable is the name given to a quantity that may assume a range of values. In the equation of a line presented above, x and y are the variables, with x on the horizontal axis and y on the vertical axis, and b and m representing factors that determine the shape of the line. To see how this equation works, consider a numerical example:

y = 9 + 3x

In this equation for a specific line, the b term has been set equal to 9 and the m term has been set equal to 3. [link] shows the values of x and y for this given equation. [link] shows this equation, and these values, in a graph. To construct the table, just plug in a series of different values for x, and then calculate what value of y results. In the figure, these points are plotted and a line is drawn through them.

Values for the slope intercept equation
x y
0 9
1 12
2 15
3 18
4 21
5 24
6 27

Slope and the algebra of straight lines

the line graph shows the following approximate points: (0, 9); (1, 12); (2, 15); (3, 18); (4, 21); (5, 24); (6, 27).
This line graph has x on the horizontal axis and y on the vertical axis. The y-intercept—that is, the point where the line intersects the y-axis—is 9. The slope of the line is 3; that is, there is a rise of 3 on the vertical axis for every increase of 1 on the horizontal axis. The slope is the same all along a straight line.

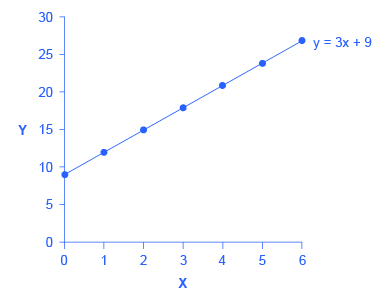
This example illustrates how the b and m terms in an equation for a straight line determine the shape of the line. The b term is called the y-intercept. The reason for this name is that, if x = 0, then the b term will reveal where the line intercepts, or crosses, the y-axis. In this example, the line hits the vertical axis at 9. The m term in the equation for the line is the slope. Remember that slope is defined as rise over run; more specifically, the slope of a line from one point to another is the change in the vertical axis divided by the change in the horizontal axis. In this example, each time the x term increases by one (the run), the y term rises by three. Thus, the slope of this line is three. Specifying a y-intercept and a slope—that is, specifying b and m in the equation for a line—will identify a specific line. Although it is rare for real-world data points to arrange themselves as an exact straight line, it often turns out that a straight line can offer a reasonable approximation of actual data.

Interpreting the Slope

The concept of slope is very useful in economics, because it measures the relationship between two variables. A positive slope means that two variables are positively related; that is, when x increases, so does y, or when x decreases, y decreases also. Graphically, a positive slope means that as a line on the line graph moves from left to right, the line rises. The length-weight relationship, shown in [link] later in this Appendix, has a positive slope. We will learn in other chapters that price and quantity supplied have a positive relationship; that is, firms will supply more when the price is higher.

Questions & Answers

differentiate between demand and supply giving examples
Lambiv Reply
differentiated between demand and supply using examples
Lambiv
what is labour ?
Lambiv
how will I do?
Venny Reply
how is the graph works?I don't fully understand
Rezat Reply
information
Eliyee
devaluation
Eliyee
t
WARKISA
hi guys good evening to all
Lambiv
multiple choice question
Aster Reply
appreciation
Eliyee
explain perfect market
Lindiwe Reply
In economics, a perfect market refers to a theoretical construct where all participants have perfect information, goods are homogenous, there are no barriers to entry or exit, and prices are determined solely by supply and demand. It's an idealized model used for analysis,
Ezea
What is ceteris paribus?
Shukri Reply
other things being equal
AI-Robot
When MP₁ becomes negative, TP start to decline. Extuples Suppose that the short-run production function of certain cut-flower firm is given by: Q=4KL-0.6K2 - 0.112 • Where is quantity of cut flower produced, I is labour input and K is fixed capital input (K-5). Determine the average product of lab
Kelo
Extuples Suppose that the short-run production function of certain cut-flower firm is given by: Q=4KL-0.6K2 - 0.112 • Where is quantity of cut flower produced, I is labour input and K is fixed capital input (K-5). Determine the average product of labour (APL) and marginal product of labour (MPL)
Kelo
yes,thank you
Shukri
Can I ask you other question?
Shukri
what is monopoly mean?
Habtamu Reply
What is different between quantity demand and demand?
Shukri Reply
Quantity demanded refers to the specific amount of a good or service that consumers are willing and able to purchase at a give price and within a specific time period. Demand, on the other hand, is a broader concept that encompasses the entire relationship between price and quantity demanded
Ezea
ok
Shukri
how do you save a country economic situation when it's falling apart
Lilia Reply
what is the difference between economic growth and development
Fiker Reply
Economic growth as an increase in the production and consumption of goods and services within an economy.but Economic development as a broader concept that encompasses not only economic growth but also social & human well being.
Shukri
production function means
Jabir
What do you think is more important to focus on when considering inequality ?
Abdisa Reply
any question about economics?
Awais Reply
sir...I just want to ask one question... Define the term contract curve? if you are free please help me to find this answer 🙏
Asui
it is a curve that we get after connecting the pareto optimal combinations of two consumers after their mutually beneficial trade offs
Awais
thank you so much 👍 sir
Asui
In economics, the contract curve refers to the set of points in an Edgeworth box diagram where both parties involved in a trade cannot be made better off without making one of them worse off. It represents the Pareto efficient allocations of goods between two individuals or entities, where neither p
Cornelius
In economics, the contract curve refers to the set of points in an Edgeworth box diagram where both parties involved in a trade cannot be made better off without making one of them worse off. It represents the Pareto efficient allocations of goods between two individuals or entities,
Cornelius
Suppose a consumer consuming two commodities X and Y has The following utility function u=X0.4 Y0.6. If the price of the X and Y are 2 and 3 respectively and income Constraint is birr 50. A,Calculate quantities of x and y which maximize utility. B,Calculate value of Lagrange multiplier. C,Calculate quantities of X and Y consumed with a given price. D,alculate optimum level of output .
Feyisa Reply
Answer
Feyisa
c
Jabir
the market for lemon has 10 potential consumers, each having an individual demand curve p=101-10Qi, where p is price in dollar's per cup and Qi is the number of cups demanded per week by the i th consumer.Find the market demand curve using algebra. Draw an individual demand curve and the market dema
Gsbwnw Reply
suppose the production function is given by ( L, K)=L¼K¾.assuming capital is fixed find APL and MPL. consider the following short run production function:Q=6L²-0.4L³ a) find the value of L that maximizes output b)find the value of L that maximizes marginal product
Abdureman
types of unemployment
Yomi Reply
What is the difference between perfect competition and monopolistic competition?
Mohammed

Get Jobilize Job Search Mobile App in your pocket Now!

Get it on Google Play Download on the App Store Now


Source:  OpenStax, Principles of economics. OpenStax CNX. Sep 19, 2014 Download for free at http://legacy.cnx.org/content/col11613/1.11
Google Play and the Google Play logo are trademarks of Google Inc.

Notification Switch

Would you like to follow the 'Principles of economics' conversation and receive update notifications?

Ask