

| << Chapter < Page | Chapter >> Page > |
An ECG is the oldest available tool for measuring electrical activity of the heart. It is a non-invasive procedure that uses leads all over the body to measure electrical current transmitted by the heart to all over the body. A cardiologist diagnoses heart conditions like MI by looking at the characteristics of the ECG signal. There are 3 main things to focus on: the P-wave, the QRS complex, and the T-wave. You can see the different portions in the following diagram:
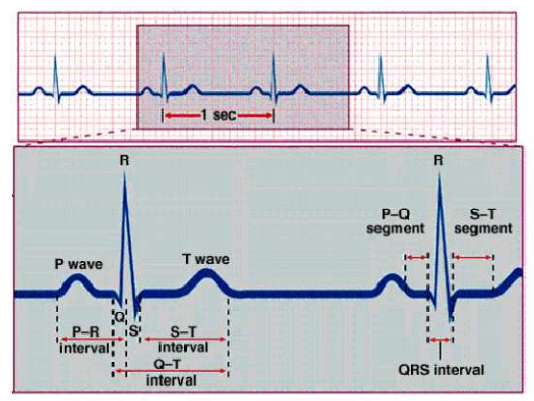
Different heart conditions have different deviations from the normal characteristics. For example, one important segment in diagnosing heart conditions is the S-T isoelectric line. A depressed or elevated S-T segment indicates a cardiac ischemia. All the important features can be found if the signal’s key points (peaks and points of inflection) and location of the points are known.
Leads are placed in strategic places on the body to measure different heart anomalies. The leads illustrate a comprehensive picture of the heart’s activity. Multiple leads are used to detect the propagation of the electrical impulse from different angles relative to the heart. There are positive and negative leads. If the electrical impulse generated by the heart moves toward a positive lead a positive deflection takes place. Similarly, when the impulse moves towards a negative lead, a negative deflection takes place. A total of 12-15 leads are placed on the body. Some are on the chest, and some are on the arms and legs. The result are waveforms that show the physiological condition of the heart.
Notification Switch
Would you like to follow the 'Ecg signal analysis for myocardial infarction detection' conversation and receive update notifications?

|
|

|
|

|
|

|
|

|
|

|
|
|
|
|

|
|

|
|

|