

| << Chapter < Page | Chapter >> Page > |
Most optical testing interferometers now use phase-shifting techniques not only because of high resolution but also because phase-shifting is a high accuracy rapid way of getting the interferogram information into the computer. Also usage of this technique makes the inherent noise in the data taking process very low. As the result in a good environment angstrom or sub-angstrom surface height measurements can be performed. As it was said above, in phase-shifting interferometry the phase difference between the interfering beams is changed at a constant rate as the detector is read out. Once the phase is determined across the interference field, the corresponding height distribution on the sample surface can be determined. The phase distribution φ(x, y) is recorded by using the CCD camera.
Let’s assign A(x, y) , B(x, y) , C(x, y) and D(x, y) to the resulting interference light intensities which are corresponded to phase-shifting steps of 0, π/ 2, π and 3 π/ 2. These intensities can be obtained by moving the reference mirror through displacements of λ/ 8, λ/ 4 and 3 λ/ 8, respectively. The equations for the resulting intensities would be:
where and are two overlapping beams from two symmetric points on the test surface and the reference respectively. Solving equations [link] – [link] , the phase map φ(x, y) of a sample surface will be given by the relation:
Once the phase is determined across the interference field pixel by pixel on a two-dimensional CCD array, the local height distribution / contour, h(x, y) , on the test surface is given by
Normally the resulted fringe can be in the form of a linear fringe pattern by adjusting the relative position between the reference mirror and sample surfaces. Hence any distorted interference fringe would indicate a local profile / contour of the test surface.
It is important to note that the Mireau objective is mounted on a capacitive closed-loop controlled PZT (piezoelectric actuator) as to enable phase shifting to be accurately implemented. The PZT is based on piezoelectric effect referred to the electric potential generated by applying pressure to piezoelectric material. This type of materials is used to convert electrical energy to mechanical energy and vice-versa. The precise motion that results when an electric potential is applied to a piezoelectric material has an importance for nanopositioning. Actuators using the piezo effect have been commercially available for 35 years and in that time have transformed the world of precision positioning and motion control.
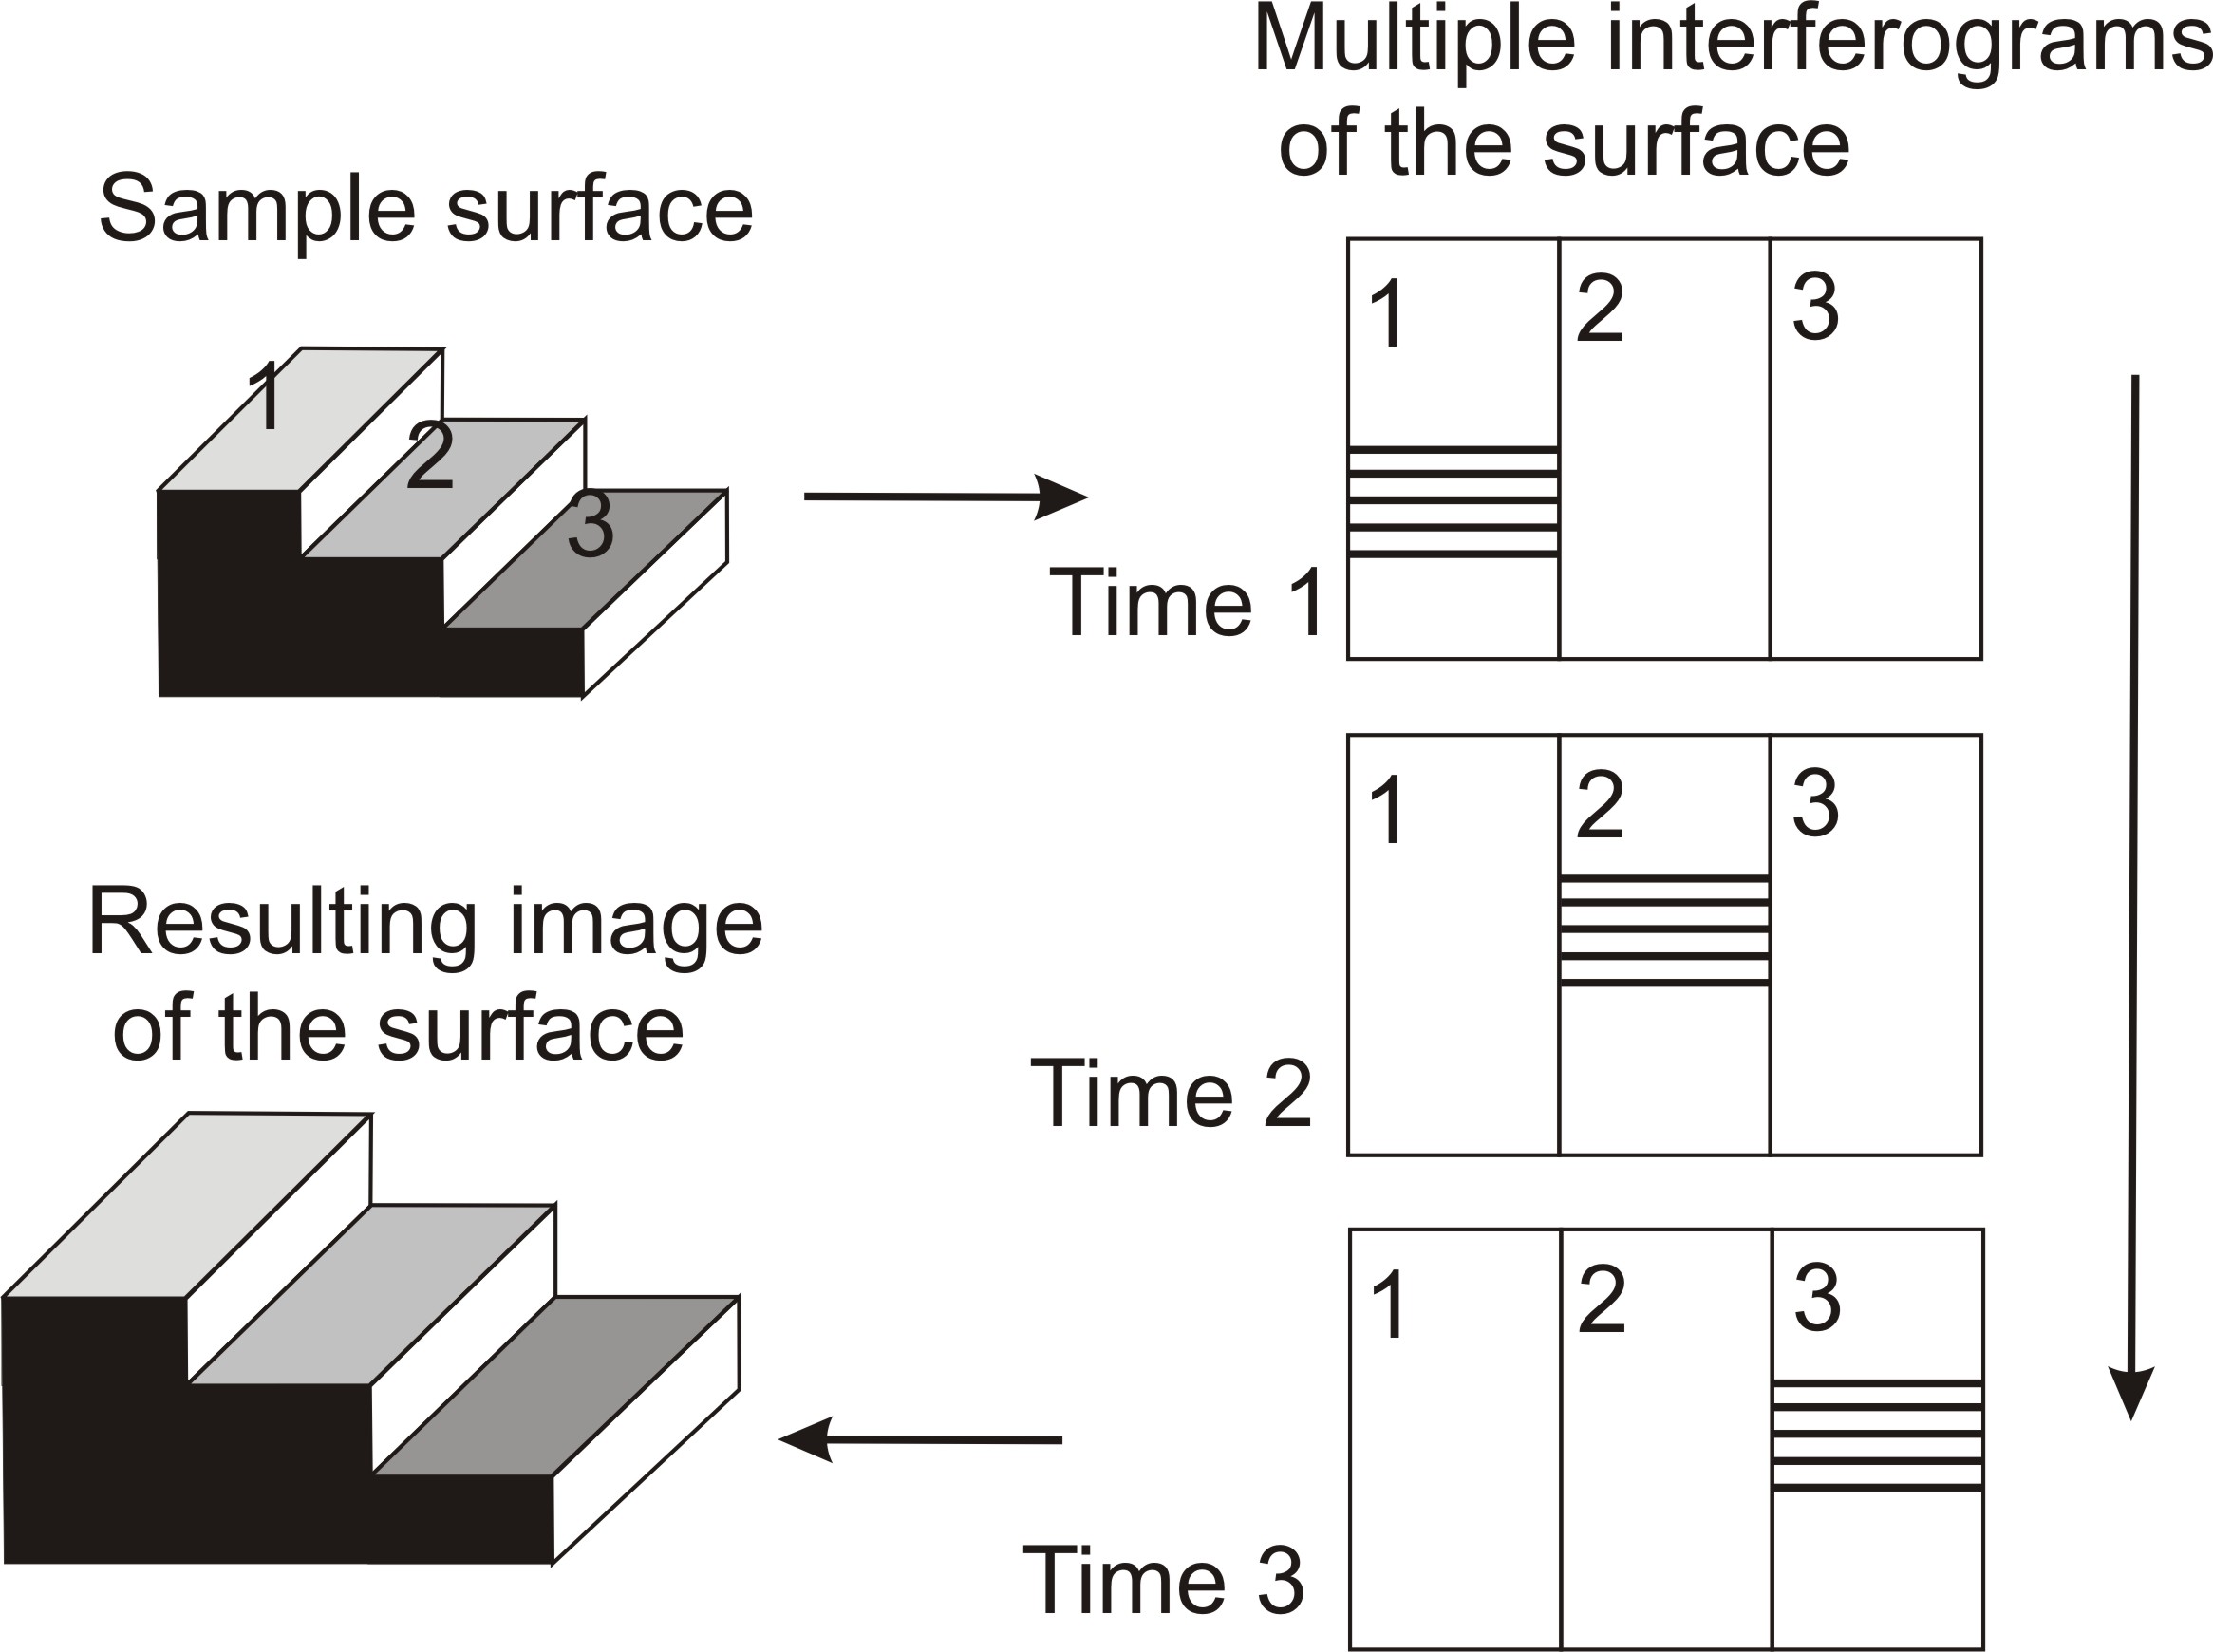
Vertical scanning interferometer also has another name; white-light interferometry (WLI) because of using the white light as a source of light. With this type of source a separate fringe system is produced for each wavelength, and the resultant intensity at any point of examined surface is obtained by summing these individual patterns. Due to the broad bandwidth of the source the coherent length L of the source is short:
Notification Switch
Would you like to follow the 'Nanomaterials and nanotechnology' conversation and receive update notifications?

|
|

|
|

|
|

|
|

|
|

|
|

|
|

|
|

|
|

|