| << Chapter < Page | Chapter >> Page > |
Fourier transform infrared spectroscopy (FTIR) is the most popular spectroscopic method used for characterizing organic and inorganic compounds. The basic modification of an FTIR from a regular IR instrument is a device called interferometer, which generates a signal that allows very fast IR spectrum acquisition. For doing so, the generatated interferogram has to be “expanded” using a Fourier transformation to generate a complete IR frequency spectrum. In the case of performing FTIR transmission studies the intensity of the transmitted signal is measured and the IR fingerprint is generated [link] .
Where I is the intensity of the samples, I b is the intensity of the background, c is the concentration of the compound, ε is the molar extinction coefficient and l is the distance that light travels through the material. A transformation of transmission to absorption spectra is usually performed and the actual concentration of the component can be calculated by applying the Beer-Lambert law [link] .
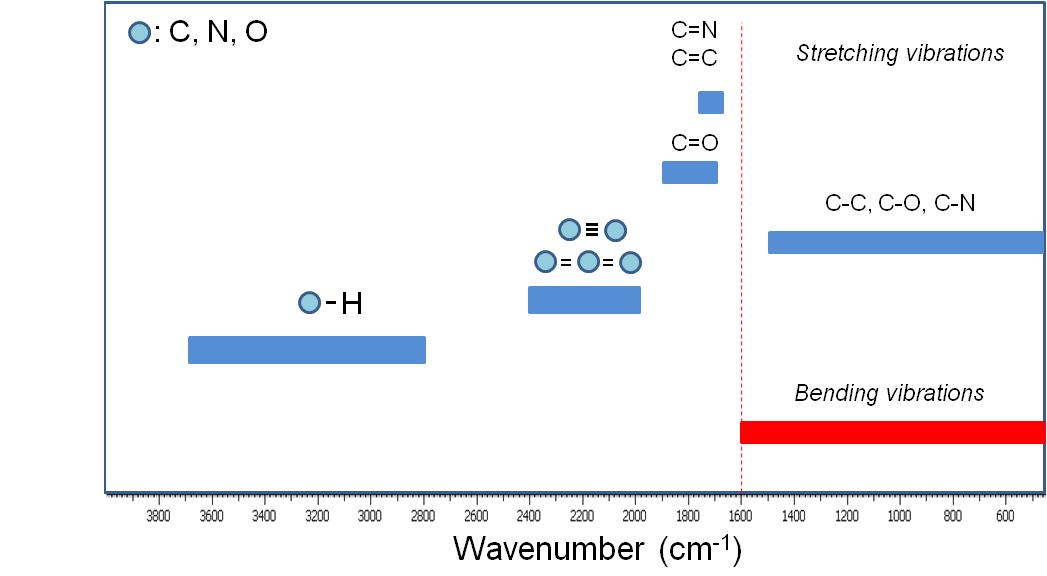
A qualitative IR-band map is presented in [link] . The absorption bands between 4000 to 1600 cm -1 represent the group frequency region and are used to identify the stretching vibrations of different bonds. At lower frequencies (from 1600 to 400 cm -1 ) vibrations due to intermolecular bond bending occurs upon IR excitation and therefore are usually not taken into account.

TGA/DSC is a powerful tool for identifying the different compounds evolved during the controlled pyrolysis and therefore provide qualitative and quantitative information about the volatile components of the sample. In metal oxide nanoparticle synthesis TGA/DSC-FTIR studies can provide qualitative and quantitative information about the volatile compounds of the nanoparticles.
TGA–FTIR results presented below were acquired using a Q600 Simultaneous TGA/DSC (SDT) instrument online with a Nicolet 5700 FTIR spectrometer. This system has a digital mass flow control and two gas inlets giving the capability to switch reacting gas during each run. It allows simultaneous weight change and differential heat flow measurements up to 1500 °C, while at the same time the outflow line is connected to the FTIR for performing gas phase compound identification. Grand-Schmidt thermographs were usually constructed to present the species evolution with time in 3 dimensions.
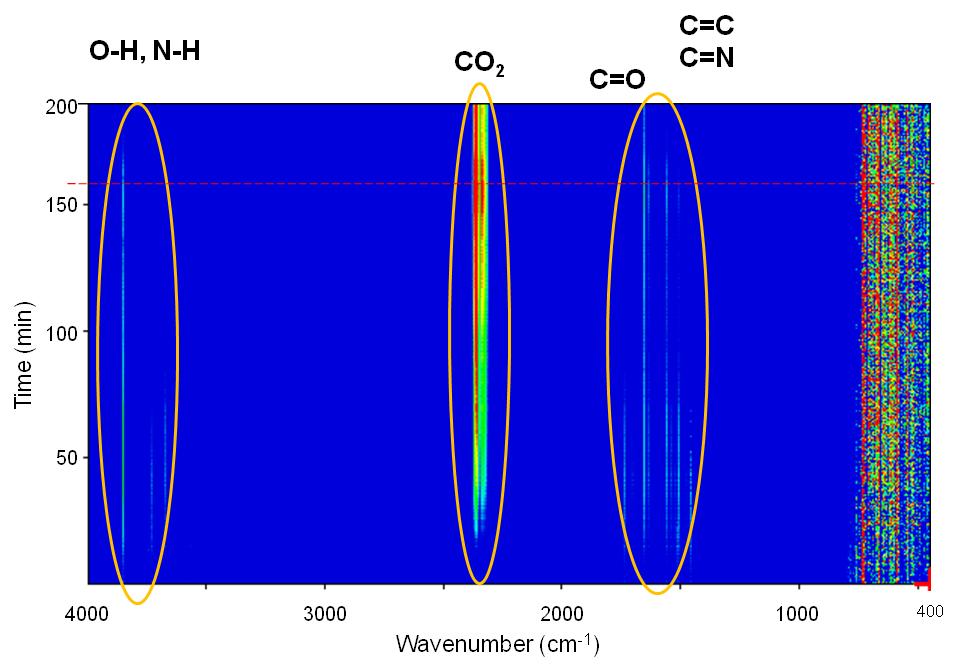
Selected IR spectra are presented in [link] . Four regions with intense peaks are observed. Between 4000 – 3550 cm -1 due to O-H bond stretching assigned to H 2 O that is always present and due to due to N-H group stretching that is assigned to the amine group of oleylamine. Between 2400 – 2250 cm -1 due to O=C=O stretching, between 1900 – 1400 cm -1 which is mainly to C=O stretching and between 800 – 400 cm -1 cannot be resolved as explained previously.

The peak intensity evolution with time can be more easily observed in [link] and [link] . As seen, CO 2 evolution increases significantly with time especially after switching our flow from N 2 to air. H 2 O seems to be present in the outflow stream up to 700 °C while the majority of the N-H amine peaks seem to disappear at about 75 min. C=N compounds are not expected to be present in the stream which leaves bands between 1900 – 1400 cm -1 assigned to C=C and C=O stretching vibrations. Unsaturated olefins resulting from the cracking of the oleylamine molecule are possible at elevated temperatures as well as the presence of CO especially under N 2 atmosphere.


From the above compound identification we can summarize and propose the following applications for TGA-FTIR. First, more complex ligands, containing aromatic rings and maybe other functional groups may provide more insight in the ligand to MO x interaction. Second, the presence of CO and CO 2 even under N 2 flow means that complete O 2 removal from the TGA and the FTIR cannot be achieved under these conditions. Even though the system was equilibrated for more than an hour, traces of O 2 are existent which create errors in our calculations.

Notification Switch
Would you like to follow the 'Nanomaterials and nanotechnology' conversation and receive update notifications?