<< Chapter < Page Chapter >> Page >

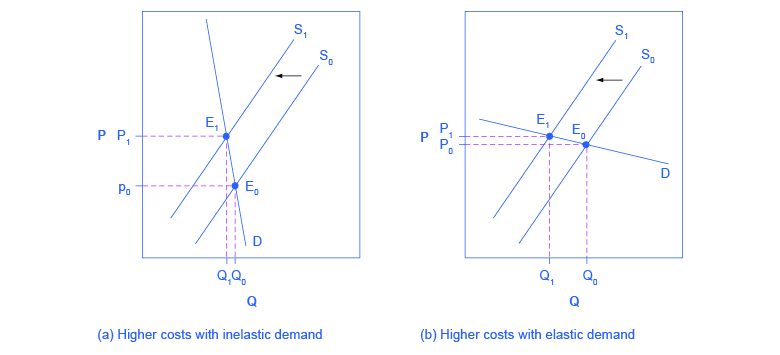
Elasticity also reveals whether firms can pass higher costs that they incur on to consumers. Addictive substances tend to fall into this category. For example, the demand for cigarettes is relatively inelastic among regular smokers who are somewhat addicted; economic research suggests that increasing the price of cigarettes by 10% leads to about a 3% reduction in the quantity of cigarettes smoked by adults, so the elasticity of demand for cigarettes is 0.3. If society increases taxes on companies that make cigarettes, the result will be, as in [link] (a), that the supply curve shifts from S 0 to S 1 . However, as the equilibrium moves from E 0 to E 1 , these taxes are mainly passed along to consumers in the form of higher prices. These higher taxes on cigarettes will raise tax revenue for the government, but they will not much affect the quantity of smoking.

If the goal is to reduce the quantity of cigarettes demanded, it must be achieved by shifting this inelastic demand back to the left, perhaps with public programs to discourage the use of cigarettes or to help people to quit. For example, anti-smoking advertising campaigns have shown some ability to reduce smoking. However, if demand for cigarettes was more elastic, as in [link] (b), then an increase in taxes that shifts supply from S 0 to S 1 and equilibrium from E 0 to E 1 would reduce the quantity of cigarettes smoked substantially. Youth smoking seems to be more elastic than adult smoking—that is, the quantity of youth smoking will fall by a greater percentage than the quantity of adult smoking in response to a given percentage increase in price.

Passing along higher costs to consumers

These two graphs show how a supply shift affects price and quantity. Figure (a) shows how supply shifts when demand is inelastic and figure (b) shows how supply shifts when demand is elastic.
Higher costs, like a higher tax on cigarette companies for the example given in the text, lead supply to shift to the left. This shift is identical in (a) and (b). However, in (a), where demand is inelastic, the cost increase can largely be passed along to consumers in the form of higher prices, without much of a decline in equilibrium quantity. In (b), demand is elastic, so the shift in supply results primarily in a lower equilibrium quantity. Consumers suffer in either case, but in (a), they suffer from paying a higher price for the same quantity, while in (b), they suffer from buying a lower quantity (and presumably needing to shift their consumption elsewhere).

Elasticity and tax incidence

The example of cigarette taxes showed that because demand is inelastic, taxes are not effective at reducing the equilibrium quantity of smoking, and they are mainly passed along to consumers in the form of higher prices. The analysis, or manner, of how the burden of a tax is divided between consumers and producers is called tax incidence    . Typically, the incidence, or burden, of a tax falls both on the consumers and producers of the taxed good. But if one wants to predict which group will bear most of the burden, all one needs to do is examine the elasticity of demand and supply. In the tobacco example, the tax burden falls on the most inelastic side of the market.

Questions & Answers

Ayele, K., 2003. Introductory Economics, 3rd ed., Addis Ababa.
Widad Reply
can you send the book attached ?
Ariel
?
Ariel
What is economics
Widad Reply
the study of how humans make choices under conditions of scarcity
AI-Robot
U(x,y) = (x×y)1/2 find mu of x for y
Desalegn Reply
U(x,y) = (x×y)1/2 find mu of x for y
Desalegn
what is ecnomics
Jan Reply
this is the study of how the society manages it's scarce resources
Belonwu
what is macroeconomic
John Reply
macroeconomic is the branch of economics which studies actions, scale, activities and behaviour of the aggregate economy as a whole.
husaini
etc
husaini
difference between firm and industry
husaini Reply
what's the difference between a firm and an industry
Abdul
firm is the unit which transform inputs to output where as industry contain combination of firms with similar production 😅😅
Abdulraufu
Suppose the demand function that a firm faces shifted from Qd  120 3P to Qd  90  3P and the supply function has shifted from QS  20  2P to QS 10  2P . a) Find the effect of this change on price and quantity. b) Which of the changes in demand and supply is higher?
Toofiq Reply
explain standard reason why economic is a science
innocent Reply
factors influencing supply
Petrus Reply
what is economic.
Milan Reply
scares means__________________ends resources. unlimited
Jan
economics is a science that studies human behaviour as a relationship b/w ends and scares means which have alternative uses
Jan
calculate the profit maximizing for demand and supply
Zarshad Reply
Why qualify 28 supplies
Milan
what are explicit costs
Nomsa Reply
out-of-pocket costs for a firm, for example, payments for wages and salaries, rent, or materials
AI-Robot
concepts of supply in microeconomics
David Reply
economic overview notes
Amahle Reply
identify a demand and a supply curve
Salome Reply
i don't know
Parul
there's a difference
Aryan
Demand curve shows that how supply and others conditions affect on demand of a particular thing and what percent demand increase whith increase of supply of goods
Israr
Hi Sir please how do u calculate Cross elastic demand and income elastic demand?
Abari

Get Jobilize Job Search Mobile App in your pocket Now!

Get it on Google Play Download on the App Store Now


Source:  OpenStax, Microeconomics. OpenStax CNX. Aug 03, 2014 Download for free at http://legacy.cnx.org/content/col11627/1.10
Google Play and the Google Play logo are trademarks of Google Inc.

Notification Switch

Would you like to follow the 'Microeconomics' conversation and receive update notifications?

Ask