<< Chapter < Page Chapter >> Page >

By the end of this section, you will be able to:

  • Calculate total utility
  • Propose decisions that maximize utility
  • Explain marginal utility and the significance of diminishing marginal utility

Information on the consumption choices of Americans is available from the Consumer Expenditure Survey carried out by the U.S. Bureau of Labor Statistics. [link] shows spending patterns for the average U.S. household. The first row shows income and, after taxes and personal savings are subtracted, it shows that, in 2015, the average U.S. household spent $48,109 on consumption. The table then breaks down consumption into various categories. The average U.S. household spent roughly one-third of its consumption on shelter and other housing expenses, another one-third on food and vehicle expenses, and the rest on a variety of items, as shown. Of course, these patterns will vary for specific households by differing levels of family income, by geography, and by preferences.

(Source: http://www.bls.gov/cex/csxann13.pdf)
U.s. consumption choices in 2015
Average Household Income before Taxes $62,481
Average Annual Expenditures $48.109
Food at home $3,264
Food away from home $2,505
Housing $16,557
Apparel and services $1,700
Transportation $7,677
Healthcare $3,157
Entertainment $2,504
Education $1,074
Personal insurance and pensions $5,357
All else: alcohol, tobacco, reading, personal care, cash contributions, miscellaneous $3,356

Total utility and diminishing marginal utility

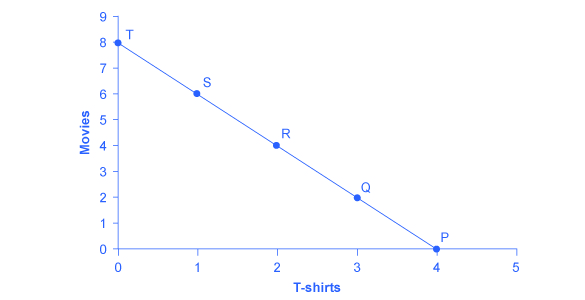
To understand how a household will make its choices, economists look at what consumers can afford, as shown in a budget constraint line    , and the total utility    or satisfaction derived from those choices. In a budget constraint line, the quantity of one good is measured on the horizontal axis and the quantity of the other good is measured on the vertical axis. The budget constraint line shows the various combinations of two goods that are affordable given consumer income. Consider the situation of José, shown in [link] . José likes to collect T-shirts and watch movies.

In [link] , the quantity of T-shirts is shown on the horizontal axis, while the quantity of movies is shown on the vertical axis. If José had unlimited income or goods were free, then he could consume without limit. But José, like all of us, faces a budget constraint    . José has a total of $56 to spend. The price of T-shirts is $14 and the price of movies is $7. Notice that the vertical intercept of the budget constraint line is at eight movies and zero T-shirts ($56/$7=8). The horizontal intercept of the budget constraint is four, where José spends of all of his money on T-shirts and no movies ($56/14=4). The slope of the budget constraint line is rise/run or –8/4=–2. The specific choices along the budget constraint line show the combinations of T-shirts and movies that are affordable.

A choice between consumption goods

The points on the graph show how a budget is affected by spending choices. Spending more money at the movies (y-axis) means that Jose' has less money to spend on T-shirts (x-axis).
José has income of $56. Movies cost $7 and T-shirts cost $14. The points on the budget constraint line show the combinations of movies and T-shirts that are affordable.

José wishes to choose the combination that will provide him with the greatest utility    , which is the term economists use to describe a person’s level of satisfaction or happiness with his or her choices.

Questions & Answers

how do you get the 2/50
Abba Reply
number of sport play by 50 student construct discrete data
Aminu Reply
width of the frangebany leaves on how to write a introduction
Theresa Reply
Solve the mean of variance
Veronica Reply
Step 1: Find the mean. To find the mean, add up all the scores, then divide them by the number of scores. ... Step 2: Find each score's deviation from the mean. ... Step 3: Square each deviation from the mean. ... Step 4: Find the sum of squares. ... Step 5: Divide the sum of squares by n – 1 or N.
kenneth
what is error
Yakuba Reply
Is mistake done to something
Vutshila
Hy
anas
hy
What is the life teble
anas
hy
Jibrin
statistics is the analyzing of data
Tajudeen Reply
what is statics?
Zelalem Reply
how do you calculate mean
Gloria Reply
diveving the sum if all values
Shaynaynay
let A1,A2 and A3 events be independent,show that (A1)^c, (A2)^c and (A3)^c are independent?
Fisaye Reply
what is statistics
Akhisani Reply
data collected all over the world
Shaynaynay
construct a less than and more than table
Imad Reply
The sample of 16 students is taken. The average age in the sample was 22 years with astandard deviation of 6 years. Construct a 95% confidence interval for the age of the population.
Aschalew Reply
Bhartdarshan' is an internet-based travel agency wherein customer can see videos of the cities they plant to visit. The number of hits daily is a normally distributed random variable with a mean of 10,000 and a standard deviation of 2,400 a. what is the probability of getting more than 12,000 hits? b. what is the probability of getting fewer than 9,000 hits?
Akshay Reply
Bhartdarshan'is an internet-based travel agency wherein customer can see videos of the cities they plan to visit. The number of hits daily is a normally distributed random variable with a mean of 10,000 and a standard deviation of 2,400. a. What is the probability of getting more than 12,000 hits
Akshay
1
Bright
Sorry i want to learn more about this question
Bright
Someone help
Bright
a= 0.20233 b=0.3384
Sufiyan
a
Shaynaynay
How do I interpret level of significance?
Mohd Reply
It depends on your business problem or in Machine Learning you could use ROC- AUC cruve to decide the threshold value
Shivam
how skewness and kurtosis are used in statistics
Owen Reply
yes what is it
Taneeya
Got questions? Join the online conversation and get instant answers!
Jobilize.com Reply

Get Jobilize Job Search Mobile App in your pocket Now!

Get it on Google Play Download on the App Store Now


Source:  OpenStax, Principles of economics. OpenStax CNX. Sep 19, 2014 Download for free at http://legacy.cnx.org/content/col11613/1.11
Google Play and the Google Play logo are trademarks of Google Inc.

Notification Switch

Would you like to follow the 'Principles of economics' conversation and receive update notifications?

Ask