<< Chapter < Page Chapter >> Page >

In addition to morbidity rates, the incidence and prevalence of mortality (death) may also be reported. A mortality rate can be expressed as the percentage of the population that has died from a disease or as the number of deaths per 100,000 persons (or other suitable standard number).

Graph of HIV prevalence and incidence in the US 1980-2010. The number o people living with HIV/AIDS was near 0 in 1980 and has increased steadily to over 1 million. There as a short plateau from 1990 to 1995. The number of new infections increased to nearly 200,000 in 1985 and dropped until 1990. It remains steady at somewhere near 50,000.
This graph compares the incidence of HIV (the number of new cases reported each year) with the prevalence (the total number of cases each year). Prevalence and incidence can also be expressed as a rate or proportion for a given population.
  • Explain the difference between incidence and prevalence.
  • Describe how morbidity and mortality rates are expressed.

Patterns of incidence

Diseases that are seen only occasionally, and usually without geographic concentration, are called sporadic disease s . Examples of sporadic diseases include tetanus , rabies , and plague . In the United States, Clostridium tetani , the bacterium that causes tetanus, is ubiquitous in the soil environment, but incidences of infection occur only rarely and in scattered locations because most individuals are vaccinated, clean wounds appropriately, or are only rarely in a situation that would cause infection. Centers for Disease Control and Prevention. “Tetanus Surveillance—United States, 2001–2008.” Morbidity and Mortality Weekly Report 60, no. 12 (2011): 365. Likewise in the United States there are a few scattered cases of plague each year, usually contracted from rodents in rural areas in the western states. Centers for Disease Control and Prevention. “Plague in the United States.” 2015. http://www.cdc.gov/plague/maps. Accessed June 1, 2016.

Diseases that are constantly present (often at a low level) in a population within a particular geographic region are called endemic disease s . For example, malaria is endemic to some regions of Brazil, but is not endemic to the United States.

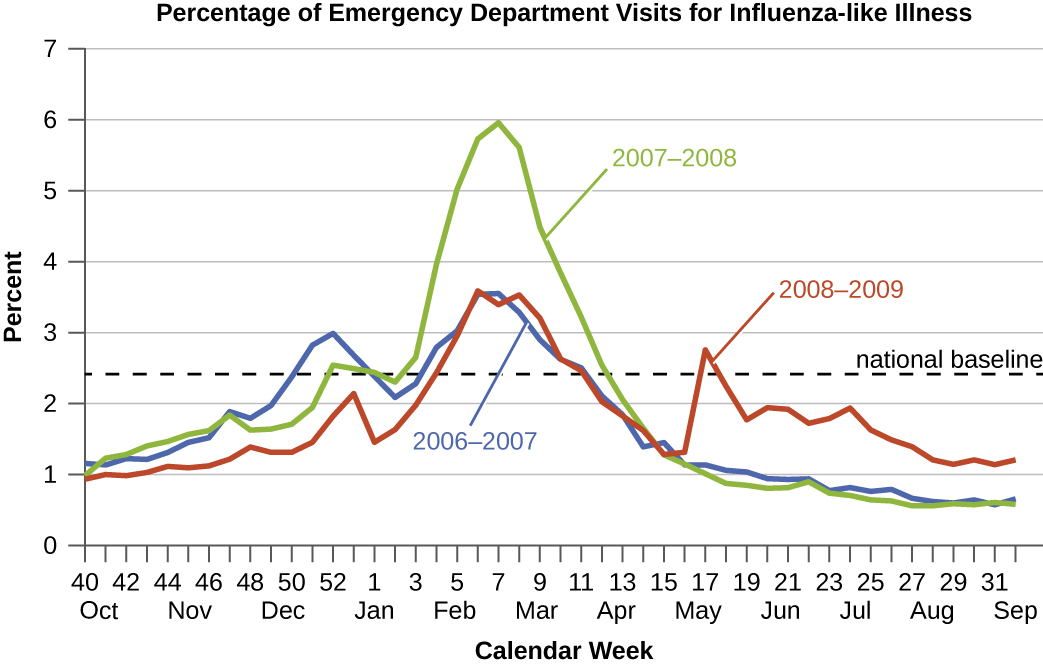
Diseases for which a larger than expected number of cases occurs in a short time within a geographic region are called epidemic disease s . Influenza is a good example of a commonly epidemic disease. Incidence patterns of influenza tend to rise each winter in the northern hemisphere. These seasonal increases are expected, so it would not be accurate to say that influenza is epidemic every winter; however, some winters have an usually large number of seasonal influenza cases in particular regions, and such situations would qualify as epidemics ( [link] and [link] ).

An epidemic disease signals the breakdown of an equilibrium in disease frequency, often resulting from some change in environmental conditions or in the population. In the case of influenza, the disruption can be due to antigenic shift or drift (see Virulence Factors of Bacterial and Viral Pathogens ), which allows influenza virus strains to circumvent the acquired immunity of their human hosts.

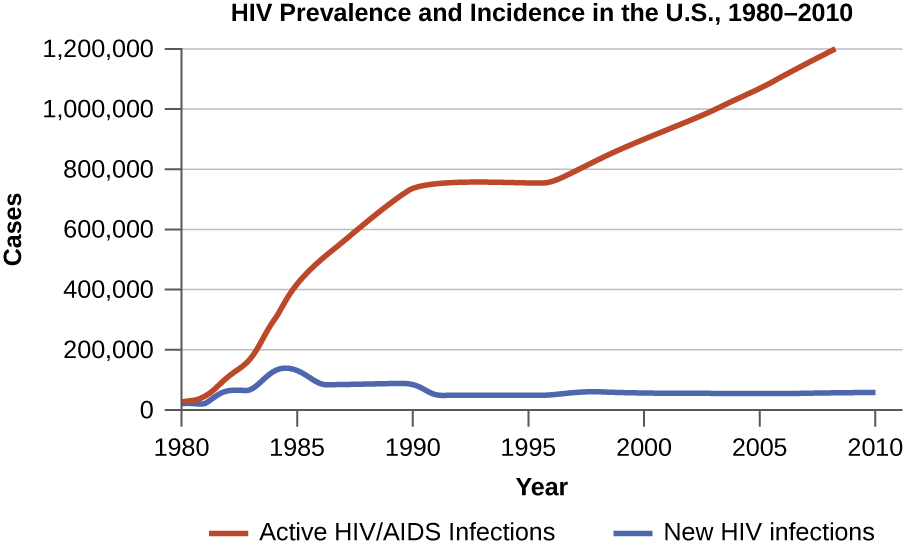
An epidemic that occurs on a worldwide scale is called a pandemic disease . For example, HIV/AIDS is a pandemic disease and novel influenza virus strains often become pandemic.

A graph of the percentage of emergency department visits for influenza-like illness. The X axis is times of the year and the Y axis is percent. The national baseline is near 2.5%. All yeas have a small peak in January and a larger peak February to April. 2007-2008 had the largest peak in February to April. 2008 – 2009 had an additional peak from May to September.
The 2007–2008 influenza season in the United States saw much higher than normal numbers of visits to emergency departments for influenza-like symptoms as compared to the previous and the following years. (credit: modification of work by Centers for Disease Control and Prevention)

Questions & Answers

A golfer on a fairway is 70 m away from the green, which sits below the level of the fairway by 20 m. If the golfer hits the ball at an angle of 40° with an initial speed of 20 m/s, how close to the green does she come?
Aislinn Reply
cm
tijani
what is titration
John Reply
what is physics
Siyaka Reply
A mouse of mass 200 g falls 100 m down a vertical mine shaft and lands at the bottom with a speed of 8.0 m/s. During its fall, how much work is done on the mouse by air resistance
Jude Reply
Can you compute that for me. Ty
Jude
what is the dimension formula of energy?
David Reply
what is viscosity?
David
what is inorganic
emma Reply
what is chemistry
Youesf Reply
what is inorganic
emma
Chemistry is a branch of science that deals with the study of matter,it composition,it structure and the changes it undergoes
Adjei
please, I'm a physics student and I need help in physics
Adjanou
chemistry could also be understood like the sexual attraction/repulsion of the male and female elements. the reaction varies depending on the energy differences of each given gender. + masculine -female.
Pedro
A ball is thrown straight up.it passes a 2.0m high window 7.50 m off the ground on it path up and takes 1.30 s to go past the window.what was the ball initial velocity
Krampah Reply
2. A sled plus passenger with total mass 50 kg is pulled 20 m across the snow (0.20) at constant velocity by a force directed 25° above the horizontal. Calculate (a) the work of the applied force, (b) the work of friction, and (c) the total work.
Sahid Reply
you have been hired as an espert witness in a court case involving an automobile accident. the accident involved car A of mass 1500kg which crashed into stationary car B of mass 1100kg. the driver of car A applied his brakes 15 m before he skidded and crashed into car B. after the collision, car A s
Samuel Reply
can someone explain to me, an ignorant high school student, why the trend of the graph doesn't follow the fact that the higher frequency a sound wave is, the more power it is, hence, making me think the phons output would follow this general trend?
Joseph Reply
Nevermind i just realied that the graph is the phons output for a person with normal hearing and not just the phons output of the sound waves power, I should read the entire thing next time
Joseph
Follow up question, does anyone know where I can find a graph that accuretly depicts the actual relative "power" output of sound over its frequency instead of just humans hearing
Joseph
"Generation of electrical energy from sound energy | IEEE Conference Publication | IEEE Xplore" ***ieeexplore.ieee.org/document/7150687?reload=true
Ryan
what's motion
Maurice Reply
what are the types of wave
Maurice
answer
Magreth
progressive wave
Magreth
hello friend how are you
Muhammad Reply
fine, how about you?
Mohammed
hi
Mujahid
A string is 3.00 m long with a mass of 5.00 g. The string is held taut with a tension of 500.00 N applied to the string. A pulse is sent down the string. How long does it take the pulse to travel the 3.00 m of the string?
yasuo Reply
Who can show me the full solution in this problem?
Reofrir Reply
Got questions? Join the online conversation and get instant answers!
Jobilize.com Reply

Get Jobilize Job Search Mobile App in your pocket Now!

Get it on Google Play Download on the App Store Now


Source:  OpenStax, Microbiology. OpenStax CNX. Nov 01, 2016 Download for free at http://cnx.org/content/col12087/1.4
Google Play and the Google Play logo are trademarks of Google Inc.

Notification Switch

Would you like to follow the 'Microbiology' conversation and receive update notifications?

Ask