<< Chapter < Page Chapter >> Page >
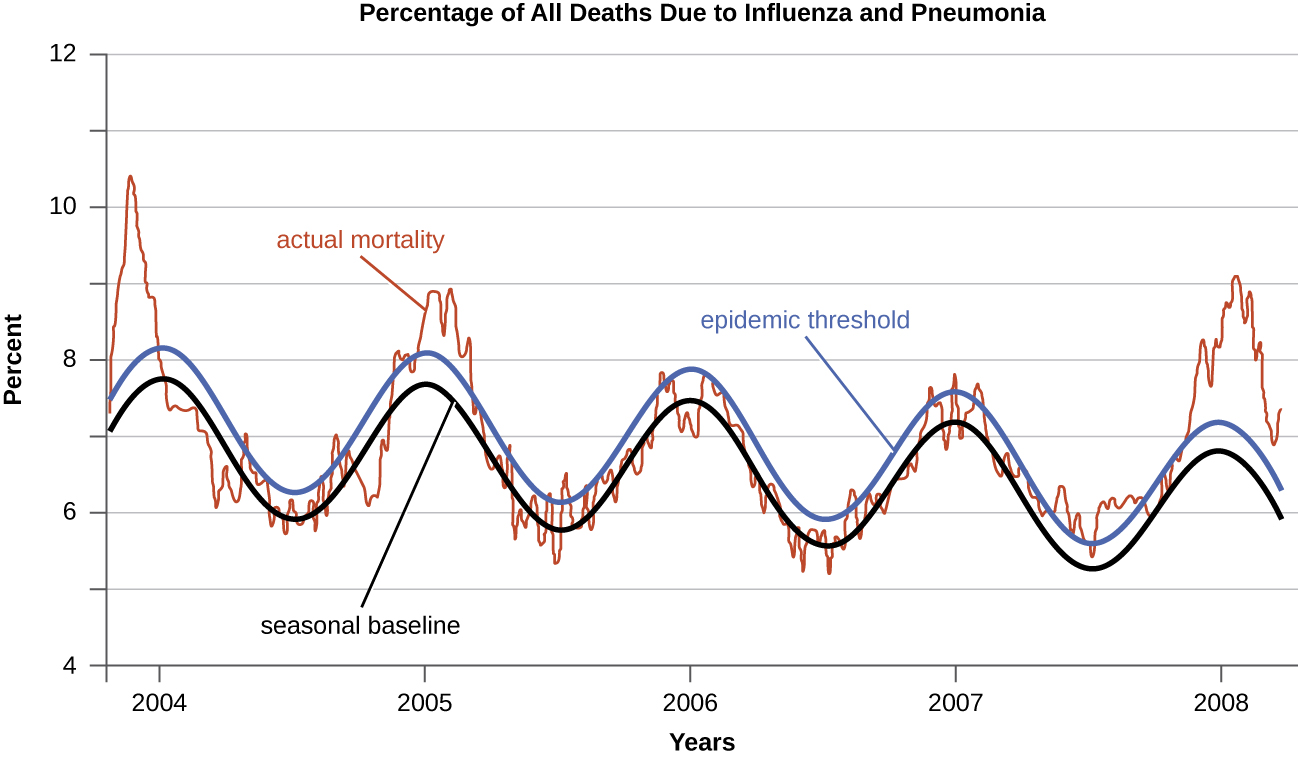
A graph of the percentage of all deaths due to influenza an pneumonia. The X axis is years and the Y axis is percent. The seasonal baseline fluctuates to a high in winter. The epidemic threshold is just a half percent higher than the baseline. The actual mortality fluctuates above and below both of these lines.
The seasonal epidemic threshold (blue curve) is set by the CDC-based data from the previous five years. When actual mortality rates exceed this threshold, a disease is considered to be epidemic. As this graph shows, pneumonia- and influenza-related mortality saw pronounced epidemics during the winters of 2003–2004, 2005, and 2008. (credit: modification of work by Centers for Disease Control and Prevention)
  • Explain the difference between sporadic and endemic disease.
  • Explain the difference between endemic and epidemic disease.

Part 2

Hospital physicians suspected that some type of food poisoning was to blame for the sudden post-Thanksgiving outbreak of gastroenteritis in western Florida. Over a two-week period, 254 cases were observed, but by the end of the first week of December, the epidemic ceased just as quickly as it had started. Suspecting a link between the cases based on the localized nature of the outbreak, hospitals handed over their medical records to the regional public health office for study.

Laboratory testing of stool samples had indicated that the infections were caused by Salmonella bacteria. Patients ranged from children as young as three to seniors in their late eighties. Cases were nearly evenly split between males and females. Across the region, there had been three confirmed deaths in the outbreak, all due to severe dehydration. In each of the fatal cases, the patients had not sought medical care until their symptoms were severe; also, all of the deceased had preexisting medical conditions such as congestive heart failure, diabetes, or high blood pressure.

After reviewing the medical records, epidemiologists with the public health office decided to conduct interviews with a randomly selected sample of patients.

  • What conclusions, if any, can be drawn from the medical records?
  • What would epidemiologists hope to learn by interviewing patients? What kinds of questions might they ask?

Jump to the next Clinical Focus box. Go back to the previous Clinical Focus box.

Etiology

When studying an epidemic, an epidemiologist’s first task is to determinate the cause of the disease, called the etiologic agent or causative agent . Connecting a disease to a specific pathogen can be challenging because of the extra effort typically required to demonstrate direct causation as opposed to a simple association. It is not enough to observe an association between a disease and a suspected pathogen; controlled experiments are needed to eliminate other possible causes. In addition, pathogens are typically difficult to detect when there is no immediate clue as to what is causing the outbreak. Signs and symptoms of disease are also commonly nonspecific, meaning that many different agents can give rise to the same set of signs and symptoms. This complicates diagnosis even when a causative agent is familiar to scientists.

Robert Koch was the first scientist to specifically demonstrate the causative agent of a disease (anthrax) in the late 1800s. Koch developed four criteria, now known as Koch’s postulates , which had to be met in order to positively link a disease with a pathogenic microbe. Without Koch’s postulates, the Golden Age of Microbiology would not have occurred. Between 1876 and 1905, many common diseases were linked with their etiologic agents, including cholera, diphtheria, gonorrhea, meningitis, plague, syphilis, tetanus, and tuberculosis. Today, we use the molecular Koch’s postulates , a variation of Koch’s original postulates that can be used to establish a link between the disease state and virulence traits unique to a pathogenic strain of a microbe. Koch’s original postulates and molecular Koch’s postulates were described in more detail in How Pathogens Cause Disease .

Questions & Answers

What are the factors that affect demand for a commodity
Florence Reply
differentiate between demand and supply giving examples
Lambiv Reply
differentiated between demand and supply using examples
Lambiv
what is labour ?
Lambiv
how will I do?
Venny Reply
how is the graph works?I don't fully understand
Rezat Reply
information
Eliyee
devaluation
Eliyee
t
WARKISA
hi guys good evening to all
Lambiv
multiple choice question
Aster Reply
appreciation
Eliyee
explain perfect market
Lindiwe Reply
In economics, a perfect market refers to a theoretical construct where all participants have perfect information, goods are homogenous, there are no barriers to entry or exit, and prices are determined solely by supply and demand. It's an idealized model used for analysis,
Ezea
What is ceteris paribus?
Shukri Reply
other things being equal
AI-Robot
When MP₁ becomes negative, TP start to decline. Extuples Suppose that the short-run production function of certain cut-flower firm is given by: Q=4KL-0.6K2 - 0.112 • Where is quantity of cut flower produced, I is labour input and K is fixed capital input (K-5). Determine the average product of lab
Kelo
Extuples Suppose that the short-run production function of certain cut-flower firm is given by: Q=4KL-0.6K2 - 0.112 • Where is quantity of cut flower produced, I is labour input and K is fixed capital input (K-5). Determine the average product of labour (APL) and marginal product of labour (MPL)
Kelo
yes,thank you
Shukri
Can I ask you other question?
Shukri
what is monopoly mean?
Habtamu Reply
What is different between quantity demand and demand?
Shukri Reply
Quantity demanded refers to the specific amount of a good or service that consumers are willing and able to purchase at a give price and within a specific time period. Demand, on the other hand, is a broader concept that encompasses the entire relationship between price and quantity demanded
Ezea
ok
Shukri
how do you save a country economic situation when it's falling apart
Lilia Reply
what is the difference between economic growth and development
Fiker Reply
Economic growth as an increase in the production and consumption of goods and services within an economy.but Economic development as a broader concept that encompasses not only economic growth but also social & human well being.
Shukri
production function means
Jabir
What do you think is more important to focus on when considering inequality ?
Abdisa Reply
any question about economics?
Awais Reply
sir...I just want to ask one question... Define the term contract curve? if you are free please help me to find this answer 🙏
Asui
it is a curve that we get after connecting the pareto optimal combinations of two consumers after their mutually beneficial trade offs
Awais
thank you so much 👍 sir
Asui
In economics, the contract curve refers to the set of points in an Edgeworth box diagram where both parties involved in a trade cannot be made better off without making one of them worse off. It represents the Pareto efficient allocations of goods between two individuals or entities, where neither p
Cornelius
In economics, the contract curve refers to the set of points in an Edgeworth box diagram where both parties involved in a trade cannot be made better off without making one of them worse off. It represents the Pareto efficient allocations of goods between two individuals or entities,
Cornelius
Suppose a consumer consuming two commodities X and Y has The following utility function u=X0.4 Y0.6. If the price of the X and Y are 2 and 3 respectively and income Constraint is birr 50. A,Calculate quantities of x and y which maximize utility. B,Calculate value of Lagrange multiplier. C,Calculate quantities of X and Y consumed with a given price. D,alculate optimum level of output .
Feyisa Reply
Answer
Feyisa
c
Jabir
the market for lemon has 10 potential consumers, each having an individual demand curve p=101-10Qi, where p is price in dollar's per cup and Qi is the number of cups demanded per week by the i th consumer.Find the market demand curve using algebra. Draw an individual demand curve and the market dema
Gsbwnw Reply
suppose the production function is given by ( L, K)=L¼K¾.assuming capital is fixed find APL and MPL. consider the following short run production function:Q=6L²-0.4L³ a) find the value of L that maximizes output b)find the value of L that maximizes marginal product
Abdureman
Got questions? Join the online conversation and get instant answers!
Jobilize.com Reply

Get Jobilize Job Search Mobile App in your pocket Now!

Get it on Google Play Download on the App Store Now


Source:  OpenStax, Microbiology. OpenStax CNX. Nov 01, 2016 Download for free at http://cnx.org/content/col12087/1.4
Google Play and the Google Play logo are trademarks of Google Inc.

Notification Switch

Would you like to follow the 'Microbiology' conversation and receive update notifications?

Ask