<< Chapter < Page
  Microbiology   Page 1 / 1
Chapter >> Page >
A micrograph showing spherical cells attached to a matrix on a surface. A photo of green water in a bucket.
Medical devices that are inserted into a patient’s body often become contaminated with a thin biofilm of microorganisms enmeshed in the sticky material they secrete. The electron micrograph (left) shows the inside walls of an in-dwelling catheter. Arrows point to the round cells of Staphylococcus aureus bacteria attached to the layers of extracellular substrate. The garbage can (right) served as a rain collector. The arrow points to a green biofilm on the sides of the container. (credit left: modification of work by Centers for Disease Control and Prevention; credit right: modification of work by NASA)

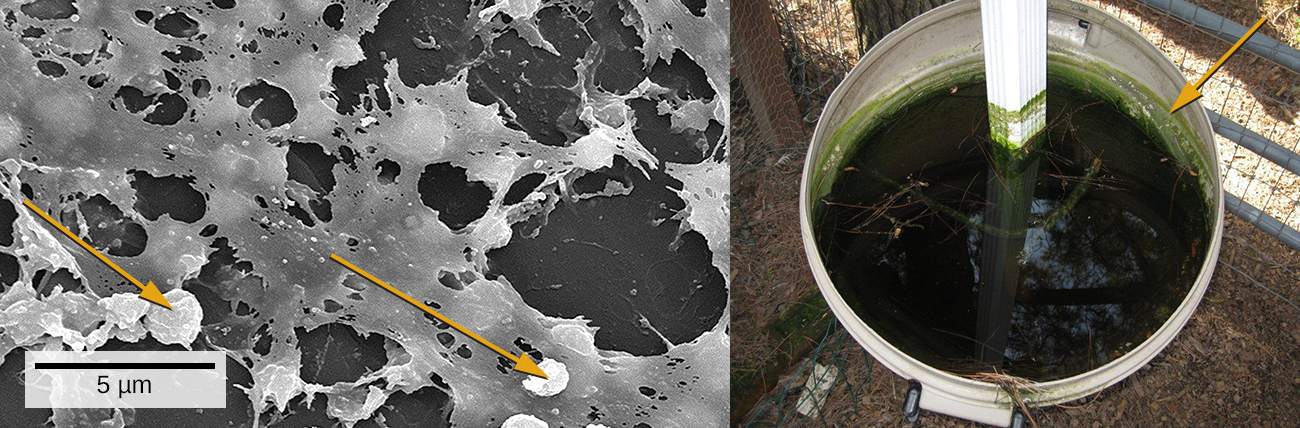
We are all familiar with the slimy layer on a pond surface or that makes rocks slippery. These are examples of biofilms—microorganisms embedded in thin layers of matrix material ( [link] ). Biofilms were long considered random assemblages of cells and had little attention from researchers. Recently, progress in visualization and biochemical methods has revealed that biofilms are an organized ecosystem within which many cells, usually of different species of bacteria, fungi, and algae, interact through cell signaling and coordinated responses. The biofilm provides a protected environment in harsh conditions and aids colonization by microorganisms. Biofilms also have clinical importance. They form on medical devices, resist routine cleaning and sterilization, and cause health-acquired infections. Within the body, biofilms form on the teeth as plaque, in the lungs of patients with cystic fibrosis, and on the cardiac tissue of patients with endocarditis. The slime layer helps protect the cells from host immune defenses and antibiotic treatments.

Studying biofilms requires new approaches. Because of the cells’ adhesion properties, many of the methods for culturing and counting cells that are explored in this chapter are not easily applied to biofilms. This is the beginning of a new era of challenges and rewarding insight into the ways that microorganisms grow and thrive in nature.

Questions & Answers

how do you get the 2/50
Abba Reply
number of sport play by 50 student construct discrete data
Aminu Reply
width of the frangebany leaves on how to write a introduction
Theresa Reply
Solve the mean of variance
Veronica Reply
Step 1: Find the mean. To find the mean, add up all the scores, then divide them by the number of scores. ... Step 2: Find each score's deviation from the mean. ... Step 3: Square each deviation from the mean. ... Step 4: Find the sum of squares. ... Step 5: Divide the sum of squares by n – 1 or N.
kenneth
what is error
Yakuba Reply
Is mistake done to something
Vutshila
Hy
anas
hy
What is the life teble
anas
hy
Jibrin
statistics is the analyzing of data
Tajudeen Reply
what is statics?
Zelalem Reply
how do you calculate mean
Gloria Reply
diveving the sum if all values
Shaynaynay
let A1,A2 and A3 events be independent,show that (A1)^c, (A2)^c and (A3)^c are independent?
Fisaye Reply
what is statistics
Akhisani Reply
data collected all over the world
Shaynaynay
construct a less than and more than table
Imad Reply
The sample of 16 students is taken. The average age in the sample was 22 years with astandard deviation of 6 years. Construct a 95% confidence interval for the age of the population.
Aschalew Reply
Bhartdarshan' is an internet-based travel agency wherein customer can see videos of the cities they plant to visit. The number of hits daily is a normally distributed random variable with a mean of 10,000 and a standard deviation of 2,400 a. what is the probability of getting more than 12,000 hits? b. what is the probability of getting fewer than 9,000 hits?
Akshay Reply
Bhartdarshan'is an internet-based travel agency wherein customer can see videos of the cities they plan to visit. The number of hits daily is a normally distributed random variable with a mean of 10,000 and a standard deviation of 2,400. a. What is the probability of getting more than 12,000 hits
Akshay
1
Bright
Sorry i want to learn more about this question
Bright
Someone help
Bright
a= 0.20233 b=0.3384
Sufiyan
a
Shaynaynay
How do I interpret level of significance?
Mohd Reply
It depends on your business problem or in Machine Learning you could use ROC- AUC cruve to decide the threshold value
Shivam
how skewness and kurtosis are used in statistics
Owen Reply
yes what is it
Taneeya
Got questions? Join the online conversation and get instant answers!
Jobilize.com Reply

Get Jobilize Job Search Mobile App in your pocket Now!

Get it on Google Play Download on the App Store Now


Source:  OpenStax, Microbiology. OpenStax CNX. Nov 01, 2016 Download for free at http://cnx.org/content/col12087/1.4
Google Play and the Google Play logo are trademarks of Google Inc.

Notification Switch

Would you like to follow the 'Microbiology' conversation and receive update notifications?

Ask