

| << Chapter < Page | Chapter >> Page > |
Due to its negatively charged backbone, DNA is strongly attracted to a positive electrode. In agarose gel electrophoresis, the gel is oriented horizontally in a buffer solution. Samples are loaded into sample wells on the side of the gel closest to the negative electrode, then drawn through the molecular sieve of the agarose matrix toward the positive electrode. The agarose matrix impedes the movement of larger molecules through the gel, whereas smaller molecules pass through more readily. Thus, the distance of migration is inversely correlated to the size of the DNA fragment, with smaller fragments traveling a longer distance through the gel. Sizes of DNA fragments within a sample can be estimated by comparison to fragments of known size in a DNA ladder also run on the same gel. To separate very large DNA fragments, such as chromosomes or viral genomes, agarose gel electrophoresis can be modified by periodically alternating the orientation of the electric field during pulsed-field gel electrophoresis (PFGE) . In PFGE , smaller fragments can reorient themselves and migrate slightly faster than larger fragments and this technique can thus serve to separate very large fragments that would otherwise travel together during standard agarose gel electrophoresis. In any of these electrophoresis techniques, the locations of the DNA or RNA fragments in the gel can be detected by various methods. One common method is adding ethidium bromide , a stain that inserts into the nucleic acids at non-specific locations and can be visualized when exposed to ultraviolet light. Other stains that are safer than ethidium bromide, a potential carcinogen, are now available.
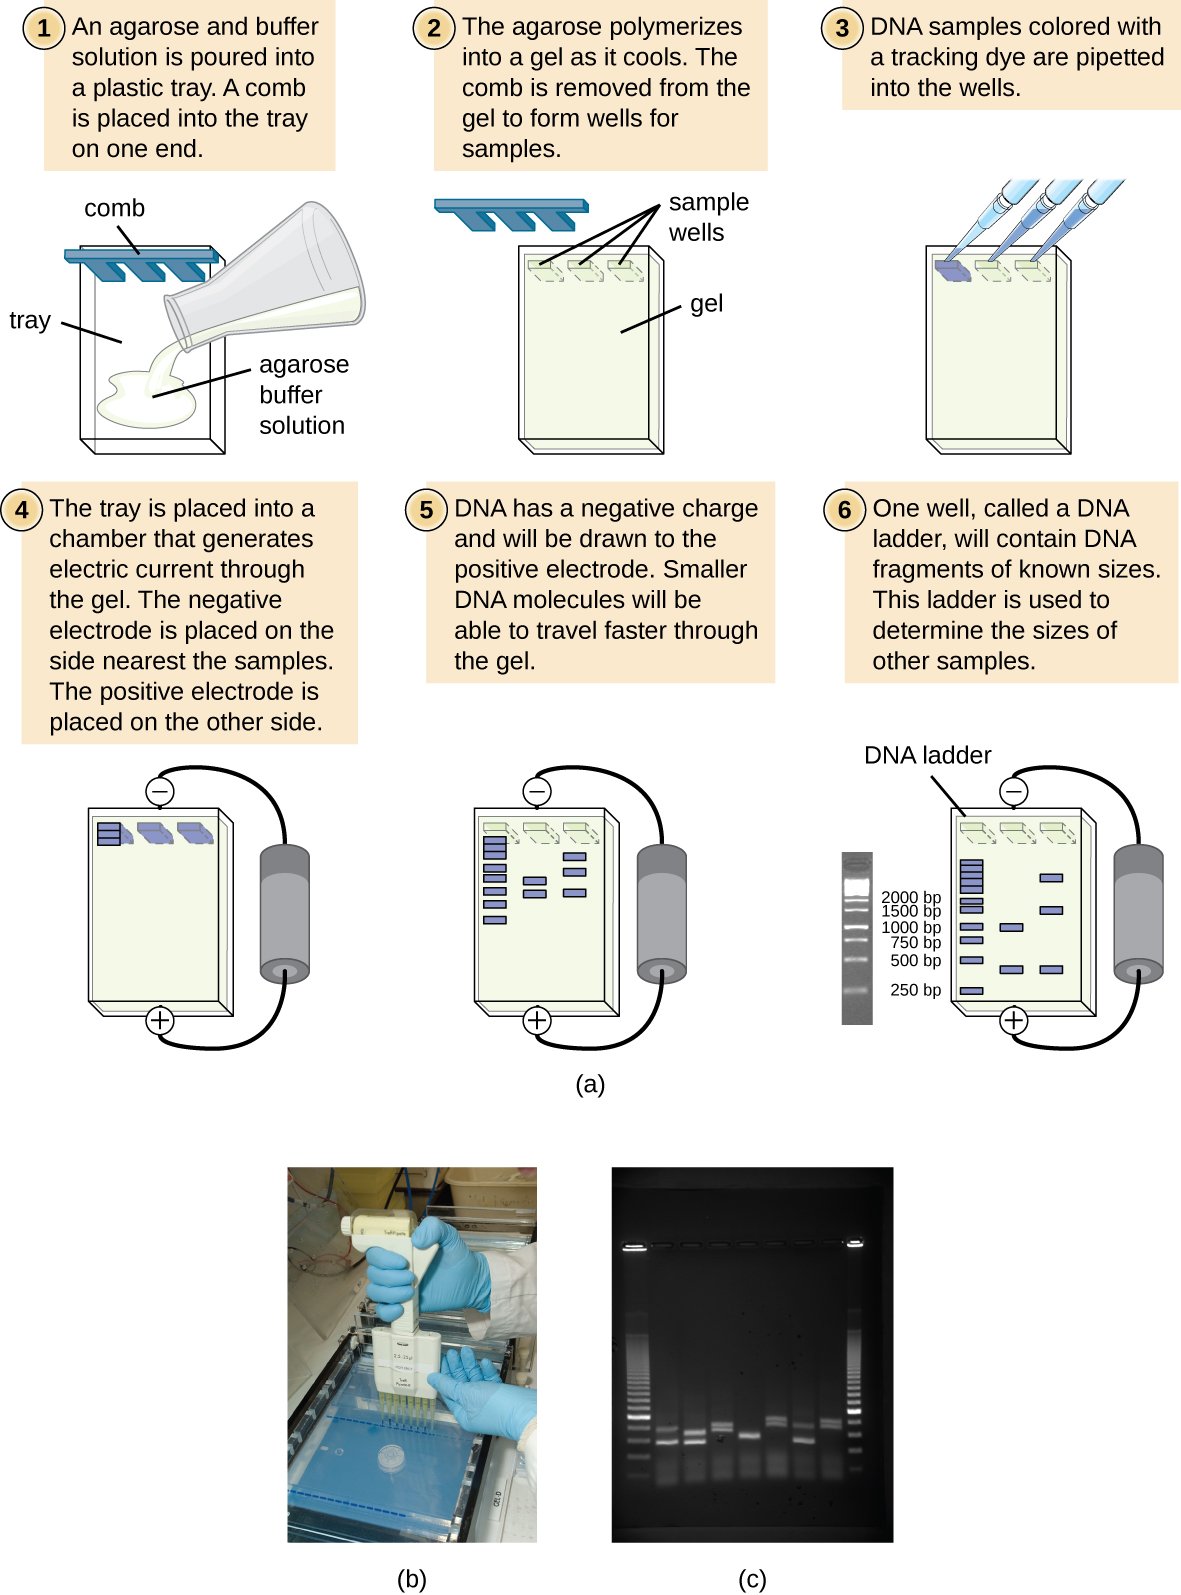
Restriction enzyme recognition sites are short (only a few nucleotides long), sequence-specific palindromes, and may be found throughout the genome. Thus, differences in DNA sequences in the genomes of individuals will lead to differences in distribution of restriction-enzyme recognition sites that can be visualized as distinct banding patterns on a gel after agarose gel electrophoresis. Restriction fragment length polymorphism (RFLP) analysis compares DNA banding patterns of different DNA samples after restriction digestion ( [link] ).
RFLP analysis has many practical applications in both medicine and forensic science . For example, epidemiologists use RFLP analysis to track and identify the source of specific microorganisms implicated in outbreaks of food poisoning or certain infectious diseases. RFLP analysis can also be used on human DNA to determine inheritance patterns of chromosomes with variant genes, including those associated with heritable diseases or to establish paternity .
Notification Switch
Would you like to follow the 'Microbiology' conversation and receive update notifications?

|
|

|
|

|
|

|
|

|
|

|
|

|
|

|
|

|
|
|
|