<< Chapter < Page Chapter >> Page >

State and local spending, 1960–2013

The graph shows total state and local spending (as a percentage of GDP) was around 10% in 1960, and over 14% in 2013. Education spending at the state and local levels has risen minimally since 1960 when it was under 4% to more recently when it was closer to 4.5% in 2013.
Spending by state and local government increased from about 10% of GDP in the early 1960s to 14–16% by the mid-1970s. It has remained at roughly that level since. The single biggest spending item is education, including both K–12 spending and support for public colleges and universities, which has been about 4–5% of GDP in recent decades. Source: (Source: Bureau of Economic Analysis.)

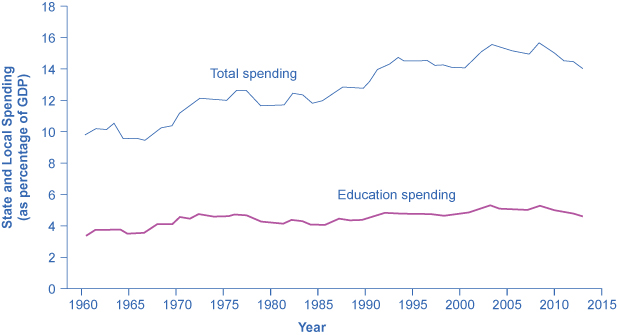
U.S. presidential candidates often run for office pledging to improve the public schools or to get tough on crime. However, in the U.S. system of government, these tasks are primarily the responsibilities of state and local governments. Indeed, in fiscal year 2014 state and local governments spent about $840 billion per year on education (including K–12 and college and university education), compared to only $100 billion by the federal government, according to usgovernmentspending.com. In other words, about 90 cents of every dollar spent on education happens at the state and local level. A politician who really wants hands-on responsibility for reforming education or reducing crime might do better to run for mayor of a large city or for state governor rather than for president of the United States.

Key concepts and summary

Fiscal policy is the set of policies that relate to federal government spending, taxation, and borrowing. In recent decades, the level of federal government spending and taxes, expressed as a share of GDP, has not changed much, typically fluctuating between about 18% to 22% of GDP. However, the level of state spending and taxes, as a share of GDP, has risen from about 12–13% to about 20% of GDP over the last four decades. The four main areas of federal spending are national defense, Social Security, healthcare, and interest payments, which together account for about 70% of all federal spending. When a government spends more than it collects in taxes, it is said to have a budget deficit. When a government collects more in taxes than it spends, it is said to have a budget surplus. If government spending and taxes are equal, it is said to have a balanced budget. The sum of all past deficits and surpluses make up the government debt.

Problems

A government starts off with a total debt of $3.5 billion. In year one, the government runs a deficit of $400 million. In year two, the government runs a deficit of $1 billion. In year three, the government runs a surplus of $200 million. What is the total debt of the government at the end of year three?

Got questions? Get instant answers now!

References

Kramer, Mattea, et. al. A People's Guide to the Federal Budget. National Priorities Project. Northampton: Interlink Books, 2012.

Kurtzleben, Danielle. “10 States With The Largest Budget Shortfalls.” U.S. News&World Report . Januray 14, 2011. http://www.usnews.com/news/articles/2011/01/14/10-states-with-the-largest-budget-shortfalls.

Miller, Rich, and William Selway. “U.S. Cities and States Start Spending Again.” BloombergBusinessweek , January 10, 2013. http://www.businessweek.com/articles/2013-01-10/u-dot-s-dot-cities-and-states-start-spending-again.

Weisman, Jonathan. “After Year of Working Around Federal Cuts, Agencies Face Fewer Options.” The New York Times , October 26, 2013. http://www.nytimes.com/2013/10/27/us/politics/after-year-of-working-around-federal-cuts-agencies-face-fewer-options.html?_r=0.

Chantrill, Christopher. USGovernmentSpending.com. “Government Spending Details: United States Federal State and Local Government Spending, Fiscal Year 2013.” http://www.usgovernmentspending.com/year_spending_2013USbn_15bs2n_20.

Questions & Answers

it is the relatively stable flow of income
Chidubem Reply
what is circular flow of income
Divine Reply
branches of macroeconomics
SHEDRACK Reply
what is Flexible exchang rate?
poudel Reply
is gdp a reliable measurement of wealth
Atega Reply
introduction to econometrics
Husseini Reply
Hi
mostafa
hi
LEMLEM
hello
Sammol
hi
Mahesh
bi
Ruqayat
hi
Ruqayat
Hi fellas
Nyawa
hey
Sammol
hi
God
hello
Jahara
Good morning
Jorge
hi
abubakar
hi
Nmesoma
hi
Mahesh
Hi
Tom
Why is unemployment rate never zero at full employment?
Priyanka Reply
bcoz of existence of frictional unemployment in our economy.
Umashankar
what is flexible exchang rate?
poudel
due to existence of the pple with disabilities
Abdulraufu
the demand of a good rises, causing the demand for another good to fall
Rushawn Reply
is it possible to leave every good at the same level
Joseph
I don't think so. because check it, if the demand for chicken increases, people will no longer consume fish like they used to causing a fall in the demand for fish
Anuolu
is not really possible to let the value of a goods to be same at the same time.....
Salome
Suppose the inflation rate is 6%, does it mean that all the goods you purchase will cost 6% more than previous year? Provide with reasoning.
Geetha Reply
Not necessarily. To measure the inflation rate economists normally use an averaged price index of a basket of certain goods. So if you purchase goods included in the basket, you will notice that you pay 6% more, otherwise not necessarily.
Waeth
discus major problems of macroeconomics
Alii Reply
what is the problem of macroeconomics
Yoal
Economic growth Stable prices and low unemployment
Ephraim
explain inflationcause and itis degre
Miresa Reply
what is inflation
Getu
increase in general price levels
WEETO
Good day How do I calculate this question: C= 100+5yd G= 2000 T= 2000 I(planned)=200. Suppose the actual output is 3000. What is the level of planned expenditures at this level of output?
Chisomo Reply
how to calculate actual output?
Chisomo
how to calculate the equilibrium income
Beshir
Criteria for determining money supply
Thapase Reply
who we can define macroeconomics in one line
Muhammad
Aggregate demand
Mohammed
C=k100 +9y and i=k50.calculate the equilibrium level of output
Mercy Reply
Hi
Isiaka
Hi
Geli
hy
Man
👋
Bahunda
hy how are you?
Man
ys
Amisha
how are you guys
Sekou
f9 guys
Amisha
how are you guys
Sekou
ys am also fine
Amisha
fine and you guys
Geli
from Nepal
Amisha
nawalparasi district from belatari
Amisha
nd u
Amisha
I am Camara from Guinea west Africa... happy to meet you guys here
Sekou
ma management ho
Amisha
ahile becheclor ho
Amisha
hjr ktm bta ho ani k kaam grnu hunxa tw
Amisha
belatari
Amisha
1st year ho
Amisha
nd u
Amisha
ahh
Amisha
kaha biratnagar
Amisha
ys
Amisha
kina k vo
Amisha
money as unit of account means what?
Kalombe
A unit of account is something that can be used to value goods and services and make calculations
Jim
all of you please speak in English I can't understand you're language
Muhammad
I want to know how can we define macroeconomics in one line
Muhammad
it must be .9 or 0.9 no Mpc is greater than 1 Y=100+.9Y+50 Y-.9Y=150 0.1Y/0.1=150/0.1 Y=1500
Kalombe
Mercy is it clear?😋
Kalombe
hi can someone help me on this question If a negative shocks shifts the IS curve to the left, what type of policy do you suggest so as to stabilize the level of output? discuss your answer using appropriate graph.
Galge Reply
if interest rate is increased this will will reduce the level of income shifting the curve to the left ◀️
Kalombe

Get Jobilize Job Search Mobile App in your pocket Now!

Get it on Google Play Download on the App Store Now


Source:  OpenStax, Macroeconomics. OpenStax CNX. Jun 16, 2014 Download for free at http://legacy.cnx.org/content/col11626/1.10
Google Play and the Google Play logo are trademarks of Google Inc.

Notification Switch

Would you like to follow the 'Macroeconomics' conversation and receive update notifications?

Ask