

| << Chapter < Page | Chapter >> Page > |
The economy has experienced an enormous inflow of foreign capital. According to the U.S. Bureau of Economic Analysis, by the third quarter of 2014, U.S. investors had accumulated $24.6 trillion of foreign assets, but foreign investors owned a total of $30.8 trillion of U.S. assets. If foreign investors were to pull their money out of the U.S. economy and invest elsewhere in the world, the result could be a significantly lower quantity of financial investment in the United States, available only at a higher interest rate. This reduced inflow of foreign financial investment could impose hardship on U.S. consumers and firms interested in borrowing.
In a modern, developed economy, financial capital often moves invisibly through electronic transfers between one bank account and another. Yet these flows of funds can be analyzed with the same tools of demand and supply as markets for goods or labor.
As we noted earlier, about 200 million Americans own credit cards, and their interest payments and fees total tens of billions of dollars each year. It is little wonder that political pressures sometimes arise for setting limits on the interest rates or fees that credit card companies charge. The firms that issue credit cards, including banks, oil companies, phone companies, and retail stores, respond that the higher interest rates are necessary to cover the losses created by those who borrow on their credit cards and who do not repay on time or at all. These companies also point out that cardholders can avoid paying interest if they pay their bills on time.
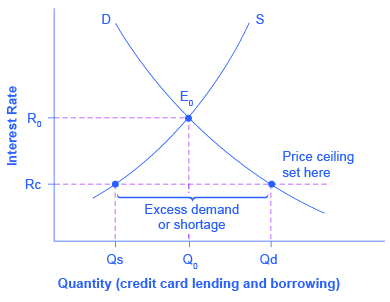
Consider the credit card market as illustrated in [link] . In this financial market, the vertical axis shows the interest rate (which is the price in the financial market). Demanders in the credit card market are households and businesses; suppliers are the companies that issue credit cards. This figure does not use specific numbers, which would be hypothetical in any case, but instead focuses on the underlying economic relationships. Imagine a law imposes a price ceiling that holds the interest rate charged on credit cards at the rate Rc, which lies below the interest rate R 0 that would otherwise have prevailed in the market. The price ceiling is shown by the horizontal dashed line in [link] . The demand and supply model predicts that at the lower price ceiling interest rate, the quantity demanded of credit card debt will increase from its original level of Q 0 to Qd; however, the quantity supplied of credit card debt will decrease from the original Q 0 to Qs. At the price ceiling (Rc), quantity demanded will exceed quantity supplied. Consequently, a number of people who want to have credit cards and are willing to pay the prevailing interest rate will find that companies are unwilling to issue cards to them. The result will be a credit shortage.
Many states do have usury laws , which impose an upper limit on the interest rate that lenders can charge. However, in many cases these upper limits are well above the market interest rate. For example, if the interest rate is not allowed to rise above 30% per year, it can still fluctuate below that level according to market forces. A price ceiling that is set at a relatively high level is nonbinding, and it will have no practical effect unless the equilibrium price soars high enough to exceed the price ceiling.
In the demand and supply analysis of financial markets, the “price” is the rate of return or the interest rate received. The quantity is measured by the money that flows from those who supply financial capital to those who demand it.
Two factors can shift the supply of financial capital to a certain investment: if people want to alter their existing levels of consumption, and if the riskiness or return on one investment changes relative to other investments. Factors that can shift demand for capital include business confidence and consumer confidence in the future—since financial investments received in the present are typically repaid in the future.
Predict how each of the following economic changes will affect the equilibrium price and quantity in the financial market for home loans. Sketch a demand and supply diagram to support your answers.
[link] shows the amount of savings and borrowing in a market for loans to purchase homes, measured in millions of dollars, at various interest rates. What is the equilibrium interest rate and quantity in the capital financial market? How can you tell? Now, imagine that because of a shift in the perceptions of foreign investors, the supply curve shifts so that there will be $10 million less supplied at every interest rate. Calculate the new equilibrium interest rate and quantity, and explain why the direction of the interest rate shift makes intuitive sense.
| Interest Rate | Qs | Qd |
|---|---|---|
| 5% | 130 | 170 |
| 6% | 135 | 150 |
| 7% | 140 | 140 |
| 8% | 145 | 135 |
| 9% | 150 | 125 |
| 10% | 155 | 110 |
CreditCards.com. 2013. http://www.creditcards.com/credit-card-news/credit-card-industry-facts-personal-debt-statistics-1276.php.
Notification Switch
Would you like to follow the 'Macroeconomics' conversation and receive update notifications?

|
|
|
|
|

|
|

|
|

|
|

|
|
|
|
|

|
|

|
|

|
|

|
|
|
|