<< Chapter < Page
  Macroeconomics   Page 1 / 1
Chapter >> Page >

The great depression

The photograph shows people lined up outside a bank during the Great Depression awaiting their relief checks.
At times, such as when many people are in need of government assistance, it is easy to tell how the economy is doing. This photograph shows people lined up during the Great Depression, waiting for relief checks. At other times, when some are doing well and others are not, it is more difficult to ascertain how the economy of a country is doing. (Credit: modification of work by the U.S. Library of Congress/Wikimedia Commons)

How is the economy doing? how does one tell?

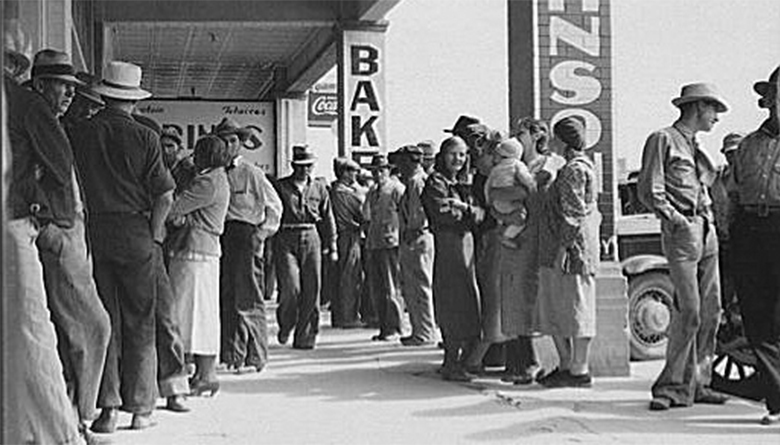
The 1990s were boom years for the U.S. economy. The late 2000s, from 2007 to 2014 were not. What causes the economy to expand or contract? Why do businesses fail when they are making all the right decisions? Why do workers lose their jobs when they are hardworking and productive? Are bad economic times a failure of the market system? Are they a failure of the government? These are all questions of macroeconomics, which we will begin to address in this chapter. We will not be able to answer all of these questions here, but we will start with the basics: How is the economy doing? How can we tell?

The macro economy includes all buying and selling, all production and consumption; everything that goes on in every market in the economy. How can we get a handle on that? The answer begins more than 80 years ago, during the Great Depression. President Franklin D. Roosevelt and his economic advisers knew things were bad—but how could they express and measure just how bad it was? An economist named Simon Kuznets, who later won the Nobel Prize for his work, came up with a way to track what the entire economy is producing. The result—gross domestic product (GDP)—remains our basic measure of macroeconomic activity. In this chapter, you will learn how GDP is constructed, how it is used, and why it is so important.

Introduction to the macroeconomic perspective

In this chapter, you will learn about:

  • Measuring the Size of the Economy: Gross Domestic Product
  • Adjusting Nominal Values to Real Values
  • Tracking Real GDP over Time
  • Comparing GDP among Countries
  • How Well GDP Measures the Well-Being of Society

Macroeconomics focuses on the economy as a whole (or on whole economies as they interact). What causes recessions? What makes unemployment stay high when recessions are supposed to be over? Why do some countries grow faster than others? Why do some countries have higher standards of living than others? These are all questions that macroeconomics addresses. Macroeconomics involves adding up the economic activity of all households and all businesses in all markets to get the overall demand and supply in the economy. However, when we do that, something curious happens. It is not unusual that what results at the macro level is different from the sum of the microeconomic parts. Indeed, what seems sensible from a microeconomic point of view can have unexpected or counterproductive results at the macroeconomic level. Imagine that you are sitting at an event with a large audience, like a live concert or a basketball game. A few people decide that they want a better view, and so they stand up. However, when these people stand up, they block the view for other people, and the others need to stand up as well if they wish to see. Eventually, nearly everyone is standing up, and as a result, no one can see much better than before. The rational decision of some individuals at the micro level—to stand up for a better view—ended up being self-defeating at the macro level. This is not macroeconomics, but it is an apt analogy.

Macroeconomics is a rather massive subject. How are we going to tackle it? [link] illustrates the structure we will use. We will study macroeconomics from three different perspectives:

  1. What are the macroeconomic goals? (Macroeconomics as a discipline does not have goals, but we do have goals for the macro economy.)
  2. What are the frameworks economists can use to analyze the macroeconomy?
  3. Finally, what are the policy tools governments can use to manage the macroeconomy?

Macroeconomic goals, framework, and policies

The illustration shows three boxes. The first is goals, the second is framework, the third is policy tools. Within each box are factors pertaining to the box.
This chart shows what macroeconomics is about. The box on the left indicates a consensus of what are the most important goals for the macro economy, the middle box lists the frameworks economists use to analyze macroeconomic changes (such as inflation or recession), and the box on the right indicates the two tools the federal government uses to influence the macro economy.

Goals

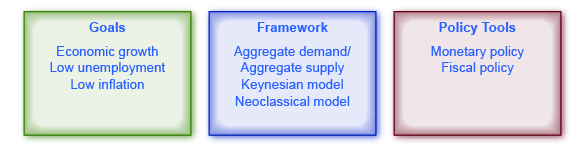
In thinking about the overall health of the macroeconomy, it is useful to consider three primary goals: economic growth, low unemployment, and low inflation.

  • Economic growth ultimately determines the prevailing standard of living in a country. Economic growth is measured by the percentage change in real (inflation-adjusted) gross domestic product. A growth rate of more than 3% is considered good.
  • Unemployment, as measured by the unemployment rate, is the percentage of people in the labor force who do not have a job. When people lack jobs, the economy is wasting a precious resource-labor, and the result is lower goods and services produced. Unemployment, however, is more than a statistic—it represents people’s livelihoods. While measured unemployment is unlikely to ever be zero, a measured unemployment rate of 5% or less is considered low (good).
  • Inflation is a sustained increase in the overall level of prices, and is measured by the consumer price index. If many people face a situation where the prices that they pay for food, shelter, and healthcare are rising much faster than the wages they receive for their labor, there will be widespread unhappiness as their standard of living declines. For that reason, low inflation—an inflation rate of 1–2%—is a major goal.

Frameworks

As you learn in the micro part of this book, principal tools used by economists are theories and models (see Welcome to Economics! for more on this). In microeconomics, we used the theories of supply and demand; in macroeconomics, we use the theories of aggregate demand (AD) and aggregate supply (AS) . This book presents two perspectives on macroeconomics: the Neoclassical perspective and the Keynesian perspective, each of which has its own version of AD and AS. Between the two perspectives, you will obtain a good understanding of what drives the macroeconomy.

Policy tools

National governments have two tools for influencing the macroeconomy. The first is monetary policy, which involves managing the money supply and interest rates. The second is fiscal policy, which involves changes in government spending/purchases and taxes.

Each of the items in [link] will be explained in detail in one or more other chapters. As you learn these things, you will discover that the goals and the policy tools are in the news almost every day.

Questions & Answers

how did you get 1640
Noor Reply
If auger is pair are the roots of equation x2+5x-3=0
Peter Reply
Wayne and Dennis like to ride the bike path from Riverside Park to the beach. Dennis’s speed is seven miles per hour faster than Wayne’s speed, so it takes Wayne 2 hours to ride to the beach while it takes Dennis 1.5 hours for the ride. Find the speed of both bikers.
MATTHEW Reply
420
Sharon
from theory: distance [miles] = speed [mph] × time [hours] info #1 speed_Dennis × 1.5 = speed_Wayne × 2 => speed_Wayne = 0.75 × speed_Dennis (i) info #2 speed_Dennis = speed_Wayne + 7 [mph] (ii) use (i) in (ii) => [...] speed_Dennis = 28 mph speed_Wayne = 21 mph
George
Let W be Wayne's speed in miles per hour and D be Dennis's speed in miles per hour. We know that W + 7 = D and W * 2 = D * 1.5. Substituting the first equation into the second: W * 2 = (W + 7) * 1.5 W * 2 = W * 1.5 + 7 * 1.5 0.5 * W = 7 * 1.5 W = 7 * 3 or 21 W is 21 D = W + 7 D = 21 + 7 D = 28
Salma
Devon is 32 32​​ years older than his son, Milan. The sum of both their ages is 54 54​. Using the variables d d​ and m m​ to represent the ages of Devon and Milan, respectively, write a system of equations to describe this situation. Enter the equations below, separated by a comma.
Aaron Reply
find product (-6m+6) ( 3m²+4m-3)
SIMRAN Reply
-42m²+60m-18
Salma
what is the solution
bill
how did you arrive at this answer?
bill
-24m+3+3mÁ^2
Susan
i really want to learn
Amira
I only got 42 the rest i don't know how to solve it. Please i need help from anyone to help me improve my solving mathematics please
Amira
Hw did u arrive to this answer.
Aphelele
hi
Bajemah
-6m(3mA²+4m-3)+6(3mA²+4m-3) =-18m²A²-24m²+18m+18mA²+24m-18 Rearrange like items -18m²A²-24m²+42m+18A²-18
Salma
complete the table of valuesfor each given equatio then graph. 1.x+2y=3
Jovelyn Reply
x=3-2y
Salma
y=x+3/2
Salma
Hi
Enock
given that (7x-5):(2+4x)=8:7find the value of x
Nandala
3x-12y=18
Kelvin
please why isn't that the 0is in ten thousand place
Grace Reply
please why is it that the 0is in the place of ten thousand
Grace
Send the example to me here and let me see
Stephen
A meditation garden is in the shape of a right triangle, with one leg 7 feet. The length of the hypotenuse is one more than the length of one of the other legs. Find the lengths of the hypotenuse and the other leg
Marry Reply
how far
Abubakar
cool u
Enock
state in which quadrant or on which axis each of the following angles given measure. in standard position would lie 89°
Abegail Reply
hello
BenJay
hi
Method
I am eliacin, I need your help in maths
Rood
how can I help
Sir
hmm can we speak here?
Amoon
however, may I ask you some questions about Algarba?
Amoon
hi
Enock
what the last part of the problem mean?
Roger
The Jones family took a 15 mile canoe ride down the Indian River in three hours. After lunch, the return trip back up the river took five hours. Find the rate, in mph, of the canoe in still water and the rate of the current.
cameron Reply
Shakir works at a computer store. His weekly pay will be either a fixed amount, $925, or $500 plus 12% of his total sales. How much should his total sales be for his variable pay option to exceed the fixed amount of $925.
mahnoor Reply
I'm guessing, but it's somewhere around $4335.00 I think
Lewis
12% of sales will need to exceed 925 - 500, or 425 to exceed fixed amount option. What amount of sales does that equal? 425 ÷ (12÷100) = 3541.67. So the answer is sales greater than 3541.67. Check: Sales = 3542 Commission 12%=425.04 Pay = 500 + 425.04 = 925.04. 925.04 > 925.00
Munster
difference between rational and irrational numbers
Arundhati Reply
When traveling to Great Britain, Bethany exchanged $602 US dollars into £515 British pounds. How many pounds did she receive for each US dollar?
Jakoiya Reply
how to reduced echelon form
Solomon Reply
Jazmine trained for 3 hours on Saturday. She ran 8 miles and then biked 24 miles. Her biking speed is 4 mph faster than her running speed. What is her running speed?
Zack Reply
d=r×t the equation would be 8/r+24/r+4=3 worked out
Sheirtina
Got questions? Join the online conversation and get instant answers!
Jobilize.com Reply

Get Jobilize Job Search Mobile App in your pocket Now!

Get it on Google Play Download on the App Store Now


Source:  OpenStax, Macroeconomics. OpenStax CNX. Jun 16, 2014 Download for free at http://legacy.cnx.org/content/col11626/1.10
Google Play and the Google Play logo are trademarks of Google Inc.

Notification Switch

Would you like to follow the 'Macroeconomics' conversation and receive update notifications?

Ask