<< Chapter < Page Chapter >> Page >

By the end of this section, you will be able to:

  • Identify patterns of inflation for the United States using data from the Consumer Price Index
  • Identify patterns of inflation on an international level

In the last three decades, inflation has been relatively low in the U.S. economy, with the Consumer Price Index typically rising 2% to 4% per year. Looking back over the twentieth century, there have been several periods where inflation caused the price level to rise at double-digit rates, but nothing has come close to hyperinflation.

Historical inflation in the u.s. economy

[link] (a) shows the level of prices in the Consumer Price Index stretching back to 1916. In this case, the base years (when the CPI is defined as 100) are set for the average level of prices that existed from 1982 to 1984. [link] (b) shows the annual percentage changes in the CPI over time, which is the inflation rate.

U.s. price level and inflation rates since 1913

Graph a shows the trends in the U.S. price level from the year 1916 to 2014. In 1916, the graph starts out close to $10, rises to around $20 in 1920, stays around $16 or $17 until 1931, when it jumps to around $15. It gradually increases, with periodic dips, until 2014, when it is around $236.   Graph b shows the trends in U.S. inflation rates from the year 1916 to 2014. In 1916, the graph starts out at 7.7%, jumps to close to 18% in 1917, drops drastically to close to –11% in 1921, goes up and down periodically, until settling to around 1.5% in 2014.
Graph a shows the trends in the U.S. price level from the year 1916 to 2014. In 1916, the graph starts out close to $10, rises to around $20 in 1920, stays around $16 or $17 until 1931, when it jumps to around $15. It gradually increases, with periodic dips, until 2014, when it is around $236. Graph b shows the trends in U.S. inflation rates from the year 1916 to 2014. In 1916, the graph starts out at 7.7%, jumps to close to 18% in 1917, drops drastically to close to –11% in 1921, goes up and down periodically, until settling to around 1.5% in 2014.

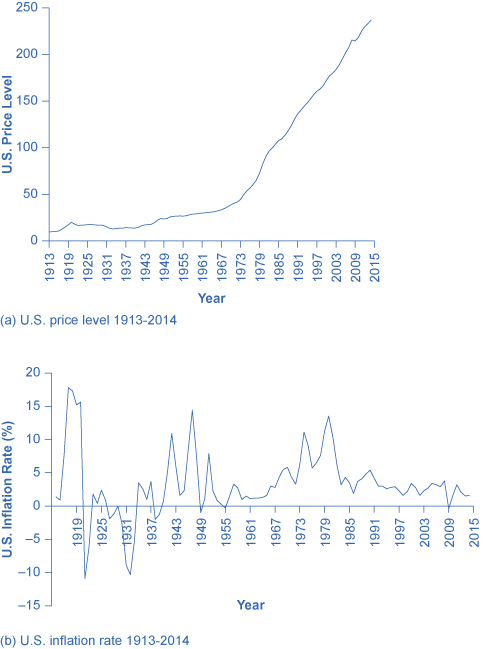
The first two waves of inflation are easy to characterize in historical terms: they are right after World War I and World War II. However, there are also two periods of severe negative inflation—called deflation    —in the early decades of the twentieth century: one following the deep recession of 1920–21 and the other during the Great Depression of the 1930s. (Since inflation is a time when the buying power of money in terms of goods and services is reduced, deflation will be a time when the buying power of money in terms of goods and services increases.) For the period from 1900 to about 1960, the major inflations and deflations nearly balanced each other out, so the average annual rate of inflation over these years was only about 1% per year. A third wave of more severe inflation arrived in the 1970s and departed in the early 1980s.

Visit this website to use an inflation calculator and discover how prices have changed in the last 100 years.

Times of recession or depression often seem to be times when the inflation rate is lower, as in the recession of 1920–1921, the Great Depression, the recession of 1980–1982, and the Great Recession in 2008–2009. There were a few months in 2009 that were deflationary, but not at an annual rate. Recessions are typically accompanied by higher levels of unemployment, and the total demand for goods falls, pulling the price level down. Conversely, the rate of inflation often, but not always, seems to start moving up when the economy is growing very strongly, like right after wartime or during the 1960s. The frameworks for macroeconomic analysis, developed in other chapters, will explain why recession often accompanies higher unemployment and lower inflation, while rapid economic growth often brings lower unemployment but higher inflation.

Questions & Answers

what is biology
Hajah Reply
the study of living organisms and their interactions with one another and their environments
AI-Robot
what is biology
Victoria Reply
HOW CAN MAN ORGAN FUNCTION
Alfred Reply
the diagram of the digestive system
Assiatu Reply
allimentary cannel
Ogenrwot
How does twins formed
William Reply
They formed in two ways first when one sperm and one egg are splited by mitosis or two sperm and two eggs join together
Oluwatobi
what is genetics
Josephine Reply
Genetics is the study of heredity
Misack
how does twins formed?
Misack
What is manual
Hassan Reply
discuss biological phenomenon and provide pieces of evidence to show that it was responsible for the formation of eukaryotic organelles
Joseph Reply
what is biology
Yousuf Reply
the study of living organisms and their interactions with one another and their environment.
Wine
discuss the biological phenomenon and provide pieces of evidence to show that it was responsible for the formation of eukaryotic organelles in an essay form
Joseph Reply
what is the blood cells
Shaker Reply
list any five characteristics of the blood cells
Shaker
lack electricity and its more savely than electronic microscope because its naturally by using of light
Abdullahi Reply
advantage of electronic microscope is easily and clearly while disadvantage is dangerous because its electronic. advantage of light microscope is savely and naturally by sun while disadvantage is not easily,means its not sharp and not clear
Abdullahi
cell theory state that every organisms composed of one or more cell,cell is the basic unit of life
Abdullahi
is like gone fail us
DENG
cells is the basic structure and functions of all living things
Ramadan
What is classification
ISCONT Reply
is organisms that are similar into groups called tara
Yamosa
in what situation (s) would be the use of a scanning electron microscope be ideal and why?
Kenna Reply
A scanning electron microscope (SEM) is ideal for situations requiring high-resolution imaging of surfaces. It is commonly used in materials science, biology, and geology to examine the topography and composition of samples at a nanoscale level. SEM is particularly useful for studying fine details,
Hilary
cell is the building block of life.
Condoleezza Reply
Got questions? Join the online conversation and get instant answers!
Jobilize.com Reply

Get Jobilize Job Search Mobile App in your pocket Now!

Get it on Google Play Download on the App Store Now


Source:  OpenStax, Macroeconomics. OpenStax CNX. Jun 16, 2014 Download for free at http://legacy.cnx.org/content/col11626/1.10
Google Play and the Google Play logo are trademarks of Google Inc.

Notification Switch

Would you like to follow the 'Macroeconomics' conversation and receive update notifications?

Ask