<< Chapter < Page Chapter >> Page >

By the end of this section, you will be able to:

  • Analyze cyclical unemployment
  • Explain the relationship between sticky wages and employment using various economic arguments
  • Apply supply and demand models to unemployment and wages

We have seen that unemployment varies across times and places. What causes changes in unemployment? There are different answers in the short run and in the long run. Let's look at the short run first.

Cyclical unemployment

Let’s make the plausible assumption that in the short run, from a few months to a few years, the quantity of hours that the average person is willing to work for a given wage does not change much, so the labor supply curve does not shift much. In addition, make the standard ceteris paribus assumption that there is no substantial short-term change in the age structure of the labor force, institutions and laws affecting the labor market, or other possibly relevant factors.

One primary determinant of the demand for labor from firms is how they perceive the state of the macro economy . If firms believe that business is expanding, then at any given wage they will desire to hire a greater quantity of labor, and the labor demand curve shifts to the right. Conversely, if firms perceive that the economy is slowing down or entering a recession, then they will wish to hire a lower quantity of labor at any given wage, and the labor demand curve will shift to the left. The variation in unemployment caused by the economy moving from expansion to recession or from recession to expansion (i.e. the business cycle) is known as cyclical unemployment    .

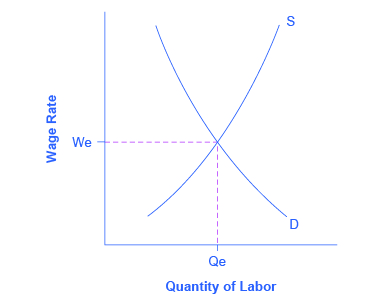
From the standpoint of the supply-and-demand model of competitive and flexible labor markets, unemployment represents something of a puzzle. In a supply-and-demand model of a labor market, as illustrated in [link] , the labor market    should move toward an equilibrium wage and quantity. At the equilibrium wage (We), the equilibrium quantity (Qe) of labor supplied by workers should be equal to the quantity of labor demanded by employers.

The unemployment and equilibrium in the labor market

The graph reveals the complexity of unemployment in that, presumably, the number of jobs available should equal the number of individuals pursuing employment.
In a labor market with flexible wages, the equilibrium will occur at wage We and quantity Qe, where the number of people looking for jobs (shown by S) equals the number of jobs available (shown by D).

One possibility for unemployment is that people who are unemployed are those who are not willing to work at the current equilibrium wage, say $10 an hour, but would be willing to work at a higher wage, like $20 per hour. The monthly Current Population Survey would count these people as unemployed, because they say they are ready and looking for work (at $20 per hour). But from an economist’s point of view, these people are choosing to be unemployed.

Probably a few people are unemployed because of unrealistic expectations about wages, but they do not represent the majority of the unemployed. Instead, unemployed people often have friends or acquaintances of similar skill levels who are employed, and the unemployed would be willing to work at the jobs and wages similar to what is being received by those people. But the employers of their friends and acquaintances do not seem to be hiring. In other words, these people are involuntarily unemployed. What causes involuntary unemployment ?

Questions & Answers

how do you get the 2/50
Abba Reply
number of sport play by 50 student construct discrete data
Aminu Reply
width of the frangebany leaves on how to write a introduction
Theresa Reply
Solve the mean of variance
Veronica Reply
Step 1: Find the mean. To find the mean, add up all the scores, then divide them by the number of scores. ... Step 2: Find each score's deviation from the mean. ... Step 3: Square each deviation from the mean. ... Step 4: Find the sum of squares. ... Step 5: Divide the sum of squares by n – 1 or N.
kenneth
what is error
Yakuba Reply
Is mistake done to something
Vutshila
Hy
anas
hy
What is the life teble
anas
hy
Jibrin
statistics is the analyzing of data
Tajudeen Reply
what is statics?
Zelalem Reply
how do you calculate mean
Gloria Reply
diveving the sum if all values
Shaynaynay
let A1,A2 and A3 events be independent,show that (A1)^c, (A2)^c and (A3)^c are independent?
Fisaye Reply
what is statistics
Akhisani Reply
data collected all over the world
Shaynaynay
construct a less than and more than table
Imad Reply
The sample of 16 students is taken. The average age in the sample was 22 years with astandard deviation of 6 years. Construct a 95% confidence interval for the age of the population.
Aschalew Reply
Bhartdarshan' is an internet-based travel agency wherein customer can see videos of the cities they plant to visit. The number of hits daily is a normally distributed random variable with a mean of 10,000 and a standard deviation of 2,400 a. what is the probability of getting more than 12,000 hits? b. what is the probability of getting fewer than 9,000 hits?
Akshay Reply
Bhartdarshan'is an internet-based travel agency wherein customer can see videos of the cities they plan to visit. The number of hits daily is a normally distributed random variable with a mean of 10,000 and a standard deviation of 2,400. a. What is the probability of getting more than 12,000 hits
Akshay
1
Bright
Sorry i want to learn more about this question
Bright
Someone help
Bright
a= 0.20233 b=0.3384
Sufiyan
a
Shaynaynay
How do I interpret level of significance?
Mohd Reply
It depends on your business problem or in Machine Learning you could use ROC- AUC cruve to decide the threshold value
Shivam
how skewness and kurtosis are used in statistics
Owen Reply
yes what is it
Taneeya
Got questions? Join the online conversation and get instant answers!
Jobilize.com Reply

Get Jobilize Job Search Mobile App in your pocket Now!

Get it on Google Play Download on the App Store Now


Source:  OpenStax, Macroeconomics. OpenStax CNX. Jun 16, 2014 Download for free at http://legacy.cnx.org/content/col11626/1.10
Google Play and the Google Play logo are trademarks of Google Inc.

Notification Switch

Would you like to follow the 'Macroeconomics' conversation and receive update notifications?

Ask