Explain historical patterns of unemployment in the U.S.
Identify trends of unemployment based on demographics
Evaluate global unemployment rates
Let’s look at how unemployment rates have changed over time and how various groups of people are affected by unemployment differently.
The historical u.s. unemployment rate
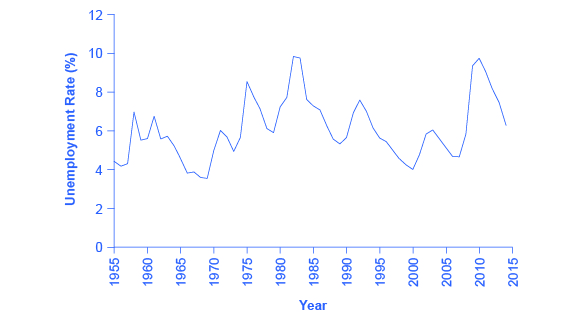
[link] shows the historical pattern of U.S. unemployment since 1955.
The u.s. unemployment rate, 1955–2015
The U.S. unemployment rate moves up and down as the economy moves in and out of recessions. But over time, the unemployment rate seems to return to a range of 4% to 6%. There does not seem to be a long-term trend toward the rate moving generally higher or generally lower. (Source:
Federal Reserve Economic Data (FRED) https://research.stlouisfed.org/fred2/series/LRUN64TTUSA156S0)
As we look at this data, several patterns stand out:
Unemployment rates do fluctuate over time. During the deep recessions of the early 1980s and of 2007–2009, unemployment reached roughly 10%. For comparison, during the Great Depression of the 1930s, the unemployment rate reached almost 25% of the labor force.
Unemployment rates in the late 1990s and into the mid-2000s were rather low by historical standards. The unemployment rate was below 5% from 1997 to 2000 and near 5% during almost all of 2006–2007. The previous time unemployment had been less than 5% for three consecutive years was three decades earlier, from 1968 to 1970.
The unemployment rate never falls all the way to zero. Indeed, it never seems to get below 3%—and it stays that low only for very short periods. (Reasons why this is the case are discussed later in this chapter.)
The timing of rises and falls in unemployment matches fairly well with the timing of upswings and downswings in the overall economy. During periods of
recession and
depression , unemployment is high. During periods of economic growth, unemployment tends to be lower.
No significant upward or downward trend in unemployment rates is apparent. This point is especially worth noting because the U.S. population nearly quadrupled from 76 million in 1900 to over 314 million by 2012. Moreover, a higher proportion of U.S. adults are now in the paid workforce, because women have entered the paid labor force in significant numbers in recent decades. Women composed 18% of the paid workforce in 1900 and nearly half of the paid workforce in 2012. But despite the increased number of workers, as well as other economic events like globalization and the continuous invention of new technologies, the economy has provided jobs without causing any long-term upward or downward trend in unemployment rates.
Unemployment rates by group
Unemployment is not distributed evenly across the U.S. population.
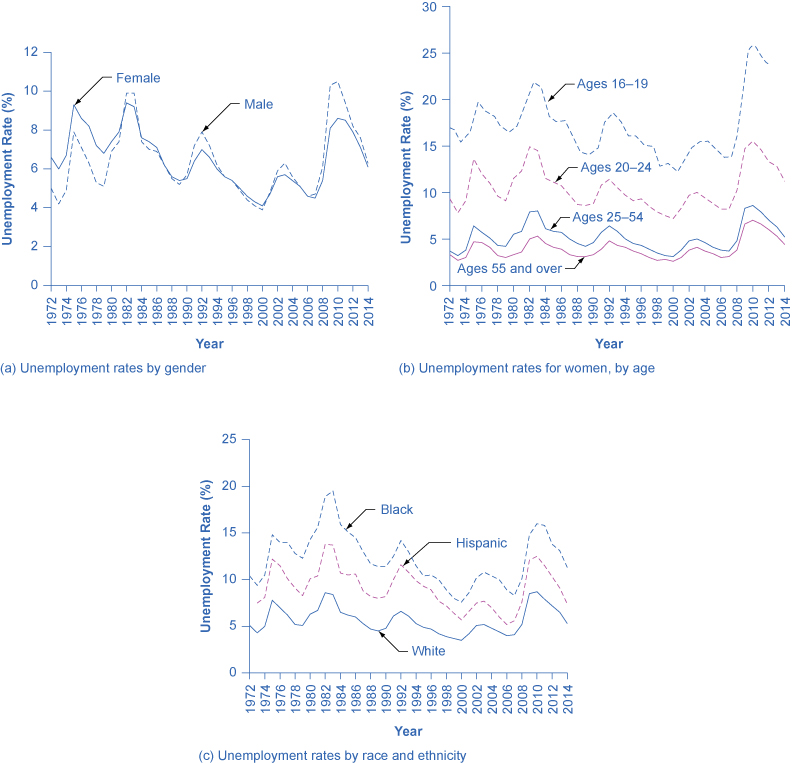
[link] shows unemployment rates broken down in various ways: by gender, age, and race/ethnicity.
Unemployment rate by demographic group
(a) By gender, 1972–2014. Unemployment rates for men used to be lower than unemployment rates for women, but in recent decades, the two rates have been very close, often with the unemployment rate for men somewhat higher. (b) By age, 1972–2014. Unemployment rates are highest for the very young and become lower with age. (c) By race and ethnicity, 1972–2014. Although unemployment rates for all groups tend to rise and fall together, the unemployment rate for whites has been lower than the unemployment rate for blacks and Hispanics in recent decades. (Source: www.bls.gov)
Questions & Answers
A golfer on a fairway is 70 m away from the green, which sits below the level of the fairway by 20 m. If the golfer hits the ball at an angle of 40° with an initial speed of 20 m/s, how close to the green does she come?
A mouse of mass 200 g falls 100 m down a vertical mine shaft and lands at the bottom with a speed of 8.0 m/s. During its fall, how much work is done on the mouse by air resistance
Chemistry is a branch of science that deals with the study of matter,it composition,it structure and the changes it undergoes
Adjei
please, I'm a physics student and I need help in physics
Adjanou
chemistry could also be understood like the sexual attraction/repulsion of the male and female elements. the reaction varies depending on the energy differences of each given gender. + masculine -female.
Pedro
A ball is thrown straight up.it passes a 2.0m high window 7.50 m off the ground on it path up and takes 1.30 s to go past the window.what was the ball initial velocity
2. A sled plus passenger with total mass 50 kg is pulled 20 m across the snow (0.20) at constant velocity by a force directed 25° above the horizontal. Calculate (a) the work of the applied force, (b) the work of friction, and (c) the total work.
you have been hired as an espert witness in a court case involving an automobile accident. the accident involved car A of mass 1500kg which crashed into stationary car B of mass 1100kg. the driver of car A applied his brakes 15 m before he skidded and crashed into car B. after the collision, car A s
can someone explain to me, an ignorant high school student, why the trend of the graph doesn't follow the fact that the higher frequency a sound wave is, the more power it is, hence, making me think the phons output would follow this general trend?
Nevermind i just realied that the graph is the phons output for a person with normal hearing and not just the phons output of the sound waves power, I should read the entire thing next time
Joseph
Follow up question, does anyone know where I can find a graph that accuretly depicts the actual relative "power" output of sound over its frequency instead of just humans hearing
Joseph
"Generation of electrical energy from sound energy | IEEE Conference Publication | IEEE Xplore" ***ieeexplore.ieee.org/document/7150687?reload=true
A string is 3.00 m long with a mass of 5.00 g. The string is held taut with a tension of 500.00 N applied to the string. A pulse is sent down the string. How long does it take the pulse to travel the 3.00 m of the string?