Explain historical patterns of unemployment in the U.S.
Identify trends of unemployment based on demographics
Evaluate global unemployment rates
Let’s look at how unemployment rates have changed over time and how various groups of people are affected by unemployment differently.
The historical u.s. unemployment rate
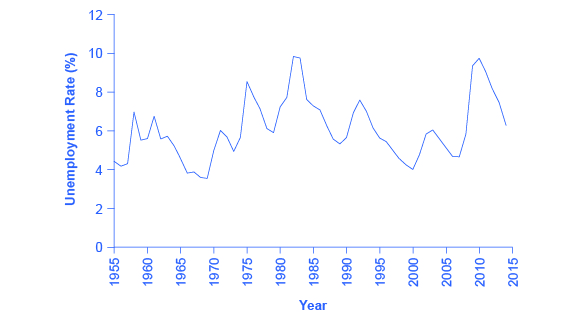
[link] shows the historical pattern of U.S. unemployment since 1955.
The u.s. unemployment rate, 1955–2015
The U.S. unemployment rate moves up and down as the economy moves in and out of recessions. But over time, the unemployment rate seems to return to a range of 4% to 6%. There does not seem to be a long-term trend toward the rate moving generally higher or generally lower. (Source:
Federal Reserve Economic Data (FRED) https://research.stlouisfed.org/fred2/series/LRUN64TTUSA156S0)
As we look at this data, several patterns stand out:
Unemployment rates do fluctuate over time. During the deep recessions of the early 1980s and of 2007–2009, unemployment reached roughly 10%. For comparison, during the Great Depression of the 1930s, the unemployment rate reached almost 25% of the labor force.
Unemployment rates in the late 1990s and into the mid-2000s were rather low by historical standards. The unemployment rate was below 5% from 1997 to 2000 and near 5% during almost all of 2006–2007. The previous time unemployment had been less than 5% for three consecutive years was three decades earlier, from 1968 to 1970.
The unemployment rate never falls all the way to zero. Indeed, it never seems to get below 3%—and it stays that low only for very short periods. (Reasons why this is the case are discussed later in this chapter.)
The timing of rises and falls in unemployment matches fairly well with the timing of upswings and downswings in the overall economy. During periods of
recession and
depression , unemployment is high. During periods of economic growth, unemployment tends to be lower.
No significant upward or downward trend in unemployment rates is apparent. This point is especially worth noting because the U.S. population nearly quadrupled from 76 million in 1900 to over 314 million by 2012. Moreover, a higher proportion of U.S. adults are now in the paid workforce, because women have entered the paid labor force in significant numbers in recent decades. Women composed 18% of the paid workforce in 1900 and nearly half of the paid workforce in 2012. But despite the increased number of workers, as well as other economic events like globalization and the continuous invention of new technologies, the economy has provided jobs without causing any long-term upward or downward trend in unemployment rates.
Unemployment rates by group
Unemployment is not distributed evenly across the U.S. population.
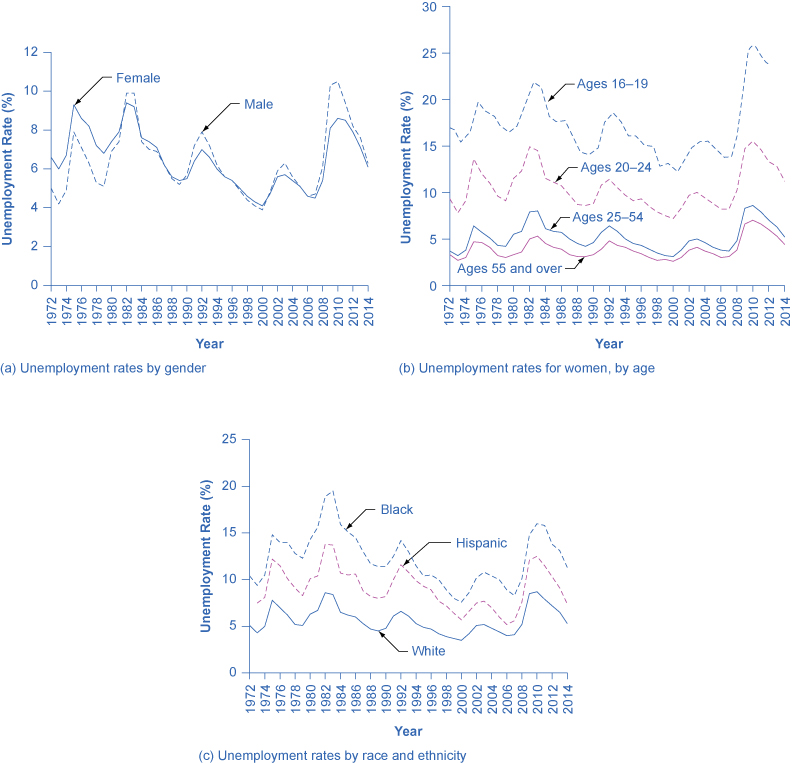
[link] shows unemployment rates broken down in various ways: by gender, age, and race/ethnicity.
Unemployment rate by demographic group
(a) By gender, 1972–2014. Unemployment rates for men used to be lower than unemployment rates for women, but in recent decades, the two rates have been very close, often with the unemployment rate for men somewhat higher. (b) By age, 1972–2014. Unemployment rates are highest for the very young and become lower with age. (c) By race and ethnicity, 1972–2014. Although unemployment rates for all groups tend to rise and fall together, the unemployment rate for whites has been lower than the unemployment rate for blacks and Hispanics in recent decades. (Source: www.bls.gov)
Questions & Answers
Three charges q_{1}=+3\mu C, q_{2}=+6\mu C and q_{3}=+8\mu C are located at (2,0)m (0,0)m and (0,3) coordinates respectively. Find the magnitude and direction acted upon q_{2} by the two other charges.Draw the correct graphical illustration of the problem above showing the direction of all forces.
To solve this problem, we need to first find the net force acting on charge q_{2}. The magnitude of the force exerted by q_{1} on q_{2} is given by F=\frac{kq_{1}q_{2}}{r^{2}} where k is the Coulomb constant, q_{1} and q_{2} are the charges of the particles, and r is the distance between them.
Muhammed
What is the direction and net electric force on q_{1}= 5µC located at (0,4)r due to charges q_{2}=7mu located at (0,0)m and q_{3}=3\mu C located at (4,0)m?
Capacitor is a separation of opposite charges using an insulator of very small dimension between them. Capacitor is used for allowing an AC (alternating current) to pass while a DC (direct current) is blocked.
Gautam
A motor travelling at 72km/m on sighting a stop sign applying the breaks such that under constant deaccelerate in the meters of 50 metres what is the magnitude of the accelerate
velocity can be 72 km/h in question. 72 km/h=20 m/s, v^2=2.a.x , 20^2=2.a.50, a=4 m/s^2.
Mehmet
A boat travels due east at a speed of 40meter per seconds across a river flowing due south at 30meter per seconds. what is the resultant speed of the boat
which has a higher temperature, 1cup of boiling water or 1teapot of boiling water which can transfer more heat 1cup of boiling water or 1 teapot of boiling water explain your . answer
I believe temperature being an intensive property does not change for any amount of boiling water whereas heat being an extensive property changes with amount/size of the system.
Someone
Scratch that
Someone
temperature for any amount of water to boil at ntp is 100⁰C (it is a state function and and intensive property) and it depends both will give same amount of heat because the surface available for heat transfer is greater in case of the kettle as well as the heat stored in it but if you talk.....
Someone
about the amount of heat stored in the system then in that case since the mass of water in the kettle is greater so more energy is required to raise the temperature b/c more molecules of water are present in the kettle
pratica A on solution of hydro chloric acid,B is a solution containing 0.5000 mole ofsodium chlorid per dm³,put A in the burret and titrate 20.00 or 25.00cm³ portion of B using melting orange as the indicator. record the deside of your burret tabulate the burret reading and calculate the average volume of acid used?
No. According to Isac Newtons law. this two bodies maybe you and the wall beside you.
Attracting depends on the mass och each body and distance between them.
Dlovan
Are you really asking if two bodies have to be charged to be influenced by Coulombs Law?
Specific heat capacity is a measure of the amount of energy required to raise the temperature of a substance by one degree Celsius (or Kelvin). It is measured in Joules per kilogram per degree Celsius (J/kg°C).
AI-Robot
specific heat capacity is the amount of energy needed to raise the temperature of a substance by one degree Celsius or kelvin
ROKEEB
Got questions? Join the online conversation and get instant answers!