<< Chapter < Page Chapter >> Page >

By the end of this section, you will be able to:

  • Identify the components of GDP on the demand side and on the supply side
  • Evaluate how gross domestic product (GDP) is measured
  • Contrast and calculate GDP, net exports, and net national product

Macroeconomics is an empirical subject, so the first step toward understanding it is to measure the economy.

How large is the U.S. economy? The size of a nation’s overall economy is typically measured by its gross domestic product (GDP)    , which is the value of all final goods and services produced within a country in a given year. The measurement of GDP involves counting up the production of millions of different goods and services—smart phones, cars, music downloads, computers, steel, bananas, college educations, and all other new goods and services produced in the current year—and summing them into a total dollar value. This task is straightforward: take the quantity of everything produced, multiply it by the price at which each product sold, and add up the total. In 2014, the U.S. GDP totaled $17.4 trillion, the largest GDP in the world.

Each of the market transactions that enter into GDP must involve both a buyer and a seller. The GDP of an economy can be measured either by the total dollar value of what is purchased in the economy, or by the total dollar value of what is produced. There is even a third way, as we will explain later.

Gdp measured by components of demand

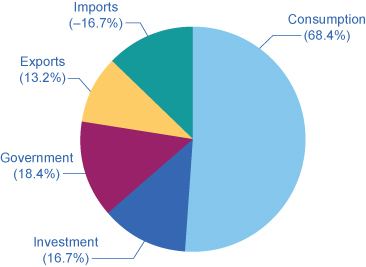
Who buys all of this production? This demand    can be divided into four main parts: consumer spending (consumption), business spending (investment), government spending on goods and services, and spending on net exports. (See the following Clear It Up feature to understand what is meant by investment.) [link] shows how these four components added up to the GDP in 2014. [link] (a) shows the levels of consumption, investment, and government purchases over time, expressed as a percentage of GDP, while [link] (b) shows the levels of exports and imports as a percentage of GDP over time. A few patterns about each of these components are worth noticing. [link] shows the components of GDP from the demand side. [link] provides a visual of the percentages.

(Source: http://bea.gov/iTable/index_nipa.cfm)
Components of u.s. gdp in 2014: from the demand side
Components of GDP on the Demand Side (in trillions of dollars) Percentage of Total
Consumption $11.9 68.4%
Investment $2.9 16.7%
Government $3.2 18.4%
Exports $2.3 13.2%
Imports –$2.9 –16.7%
Total GDP $17.4 100%

Percentage of components of u.s. gdp on the demand side

This pie chart shows the percentage of components of U.S. GDP on the demand side as follows: Consumption: 68.4% Investment: 16.7% Government: 18.4% Exports: 13.2% Imports: −16.7%
Consumption makes up over half of the demand side components of the GDP. (Source: http://bea.gov/iTable/index_nipa.cfm)

What is meant by the word “investment”?

What do economists mean by investment, or business spending? In calculating GDP, investment does not refer to the purchase of stocks and bonds or the trading of financial assets. It refers to the purchase of new capital goods, that is, new commercial real estate (such as buildings, factories, and stores) and equipment, residential housing construction, and inventories. Inventories that are produced this year are included in this year’s GDP—even if they have not yet sold. From the accountant’s perspective, it is as if the firm invested in its own inventories. Business investment in 2014 was almost $3 trillion, according to the Bureau of Economic Analysis.

Questions & Answers

how do you get the 2/50
Abba Reply
number of sport play by 50 student construct discrete data
Aminu Reply
width of the frangebany leaves on how to write a introduction
Theresa Reply
Solve the mean of variance
Veronica Reply
Step 1: Find the mean. To find the mean, add up all the scores, then divide them by the number of scores. ... Step 2: Find each score's deviation from the mean. ... Step 3: Square each deviation from the mean. ... Step 4: Find the sum of squares. ... Step 5: Divide the sum of squares by n – 1 or N.
kenneth
what is error
Yakuba Reply
Is mistake done to something
Vutshila
Hy
anas
hy
What is the life teble
anas
hy
Jibrin
statistics is the analyzing of data
Tajudeen Reply
what is statics?
Zelalem Reply
how do you calculate mean
Gloria Reply
diveving the sum if all values
Shaynaynay
let A1,A2 and A3 events be independent,show that (A1)^c, (A2)^c and (A3)^c are independent?
Fisaye Reply
what is statistics
Akhisani Reply
data collected all over the world
Shaynaynay
construct a less than and more than table
Imad Reply
The sample of 16 students is taken. The average age in the sample was 22 years with astandard deviation of 6 years. Construct a 95% confidence interval for the age of the population.
Aschalew Reply
Bhartdarshan' is an internet-based travel agency wherein customer can see videos of the cities they plant to visit. The number of hits daily is a normally distributed random variable with a mean of 10,000 and a standard deviation of 2,400 a. what is the probability of getting more than 12,000 hits? b. what is the probability of getting fewer than 9,000 hits?
Akshay Reply
Bhartdarshan'is an internet-based travel agency wherein customer can see videos of the cities they plan to visit. The number of hits daily is a normally distributed random variable with a mean of 10,000 and a standard deviation of 2,400. a. What is the probability of getting more than 12,000 hits
Akshay
1
Bright
Sorry i want to learn more about this question
Bright
Someone help
Bright
a= 0.20233 b=0.3384
Sufiyan
a
Shaynaynay
How do I interpret level of significance?
Mohd Reply
It depends on your business problem or in Machine Learning you could use ROC- AUC cruve to decide the threshold value
Shivam
how skewness and kurtosis are used in statistics
Owen Reply
yes what is it
Taneeya
Got questions? Join the online conversation and get instant answers!
Jobilize.com Reply

Get Jobilize Job Search Mobile App in your pocket Now!

Get it on Google Play Download on the App Store Now


Source:  OpenStax, Macroeconomics. OpenStax CNX. Jun 16, 2014 Download for free at http://legacy.cnx.org/content/col11626/1.10
Google Play and the Google Play logo are trademarks of Google Inc.

Notification Switch

Would you like to follow the 'Macroeconomics' conversation and receive update notifications?

Ask