<< Chapter < Page Chapter >> Page >

By the end of this section, you will be able to:

  • Differentiate between infinite and zero elasticity
  • Analyze graphs in order to classify elasticity as constant unitary, infinite, or zero

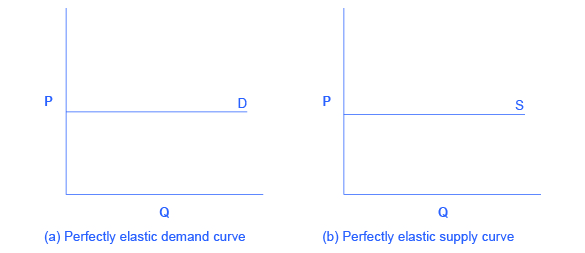
There are two extreme cases of elasticity: when elasticity equals zero and when it is infinite. A third case is that of constant unitary elasticity. We will describe each case. Infinite elasticity or perfect elasticity    refers to the extreme case where either the quantity demanded (Qd) or supplied (Qs) changes by an infinite amount in response to any change in price at all. In both cases, the supply and the demand curve    are horizontal as shown in [link] . While perfectly elastic supply curves are unrealistic, goods with readily available inputs and whose production can be easily expanded will feature highly elastic supply curves. Examples include pizza, bread, books and pencils. Similarly, perfectly elastic demand is an extreme example. But luxury goods, goods that take a large share of individuals’ income, and goods with many substitutes are likely to have highly elastic demand curves. Examples of such goods are Caribbean cruises and sports vehicles.

Infinite elasticity

Two graphs, side by side, show that perfectly elastic demand and perfectly elastic supply are both straight, horizontal lines.
The horizontal lines show that an infinite quantity will be demanded or supplied at a specific price. This illustrates the cases of a perfectly (or infinitely) elastic demand curve and supply curve. The quantity supplied or demanded is extremely responsive to price changes, moving from zero for prices close to P to infinite when price reach P.

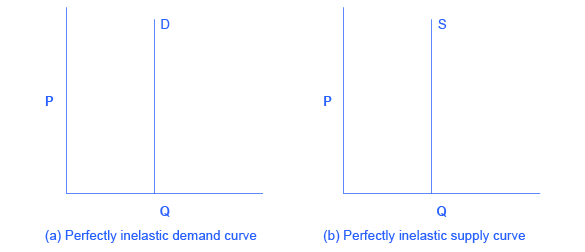
Zero elasticity or perfect inelasticity    , as depicted in [link] refers to the extreme case in which a percentage change in price, no matter how large, results in zero change in quantity. While a perfectly inelastic supply is an extreme example, goods with limited supply of inputs are likely to feature highly inelastic supply curves. Examples include diamond rings or housing in prime locations such as apartments facing Central Park in New York City. Similarly, while perfectly inelastic demand is an extreme case, necessities with no close substitutes are likely to have highly inelastic demand curves. This is the case of life-saving drugs and gasoline.

Zero elasticity

The two graphs show that zero elasticity of supply and zero elasticity of demand are straight, vertical lines.
The vertical supply curve and vertical demand curve show that there will be zero percentage change in quantity (a) demanded or (b) supplied, regardless of the price.

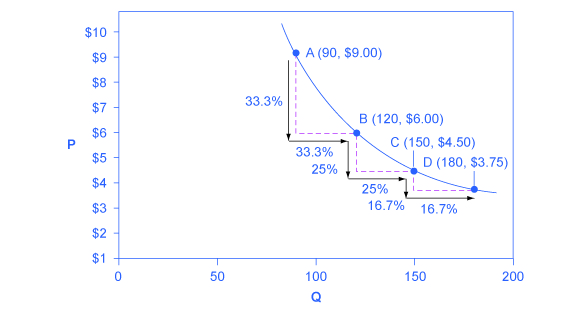
Constant unitary elasticity , in either a supply or demand curve, occurs when a price change of one percent results in a quantity change of one percent. [link] shows a demand curve with constant unit elasticity. As we move down the demand curve from A to B, the price falls by 33% and quantity demanded rises by 33%; as you move from B to C, the price falls by 25% and the quantity demanded rises by 25%; as you move from C to D, the price falls by 16% and the quantity rises by 16%. Notice that in absolute value, the declines in price, as you step down the demand curve, are not identical. Instead, the price falls by $3 from A to B, by a smaller amount of $1.50 from B to C, and by a still smaller amount of $0.75 from C to D. As a result, a demand curve with constant unitary elasticity moves from a steeper slope on the left and a flatter slope on the right—and a curved shape overall.

A constant unitary elasticity demand curve

This graph shows how a demand curve with unitary elasticity at all points will always be a curved line.
A demand curve with constant unitary elasticity will be a curved line. Notice how price and quantity demanded change by an identical amount in each step down the demand curve.

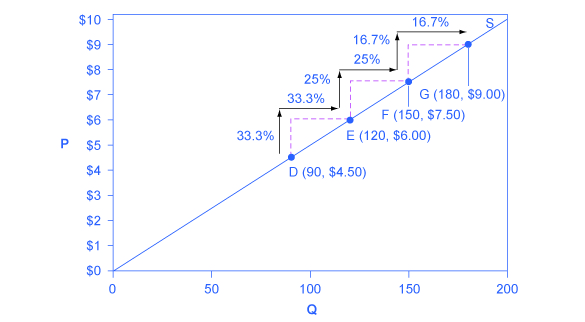
Unlike the demand curve with unitary elasticity, the supply curve with unitary elasticity is represented by a straight line. In moving up the supply curve from left to right, each increase in quantity of 30, from 90 to 120 to 150 to 180, is equal in absolute value. However, in percentage value, the steps are decreasing, from 33.3% to 25% to 16.7%, because the original quantity points in each percentage calculation are getting larger and larger, which expands the denominator in the elasticity calculation.

Consider the price changes moving up the supply curve in [link] . From points D to E to F and to G on the supply curve, each step of $1.50 is the same in absolute value. However, if the price changes are measured in percentage change terms, they are also decreasing, from 33.3% to 25% to 16.7%, because the original price points in each percentage calculation are getting larger and larger in value. Along the constant unitary elasticity supply curve, the percentage quantity increases on the horizontal axis exactly match the percentage price increases on the vertical axis—so this supply curve has a constant unitary elasticity at all points.

A constant unitary elasticity supply curve

This graph shows that a supply curve with unitary elasticity at all points will always be a straight line.
A constant unitary elasticity supply curve is a straight line reaching up from the origin. Between each point, the percentage increase in quantity supplied is the same as the percentage increase in price.

Key concepts and summary

Infinite or perfect elasticity refers to the extreme case where either the quantity demanded or supplied changes by an infinite amount in response to any change in price at all. Zero elasticity refers to the extreme case in which a percentage change in price, no matter how large, results in zero change in quantity. Constant unitary elasticity in either a supply or demand curve refers to a situation where a price change of one percent results in a quantity change of one percent.

Problems

The supply of paintings by Leonardo Da Vinci, who painted the Mona Lisa and The Last Supper and died in 1519, is highly inelastic. Sketch a supply and demand diagram, paying attention to the appropriate elasticities, to illustrate that demand for these paintings will determine the price.

Got questions? Get instant answers now!

Say that a certain stadium for professional football has 70,000 seats. What is the shape of the supply curve for tickets to football games at that stadium? Explain.

Got questions? Get instant answers now!

When someone’s kidneys fail, the person needs to have medical treatment with a dialysis machine (unless or until they receive a kidney transplant) or they will die. Sketch a supply and demand diagram, paying attention to the appropriate elasticities, to illustrate that the supply of such dialysis machines will primarily determine the price.

Got questions? Get instant answers now!

Questions & Answers

it is the relatively stable flow of income
Chidubem Reply
what is circular flow of income
Divine Reply
branches of macroeconomics
SHEDRACK Reply
what is Flexible exchang rate?
poudel Reply
is gdp a reliable measurement of wealth
Atega Reply
introduction to econometrics
Husseini Reply
Hi
mostafa
hi
LEMLEM
hello
Sammol
hi
Mahesh
bi
Ruqayat
hi
Ruqayat
Hi fellas
Nyawa
hey
Sammol
hi
God
hello
Jahara
Good morning
Jorge
hi
abubakar
hi
Nmesoma
hi
Mahesh
Hi
Tom
Why is unemployment rate never zero at full employment?
Priyanka Reply
bcoz of existence of frictional unemployment in our economy.
Umashankar
what is flexible exchang rate?
poudel
due to existence of the pple with disabilities
Abdulraufu
the demand of a good rises, causing the demand for another good to fall
Rushawn Reply
is it possible to leave every good at the same level
Joseph
I don't think so. because check it, if the demand for chicken increases, people will no longer consume fish like they used to causing a fall in the demand for fish
Anuolu
is not really possible to let the value of a goods to be same at the same time.....
Salome
Suppose the inflation rate is 6%, does it mean that all the goods you purchase will cost 6% more than previous year? Provide with reasoning.
Geetha Reply
Not necessarily. To measure the inflation rate economists normally use an averaged price index of a basket of certain goods. So if you purchase goods included in the basket, you will notice that you pay 6% more, otherwise not necessarily.
Waeth
discus major problems of macroeconomics
Alii Reply
what is the problem of macroeconomics
Yoal
Economic growth Stable prices and low unemployment
Ephraim
explain inflationcause and itis degre
Miresa Reply
what is inflation
Getu
increase in general price levels
WEETO
Good day How do I calculate this question: C= 100+5yd G= 2000 T= 2000 I(planned)=200. Suppose the actual output is 3000. What is the level of planned expenditures at this level of output?
Chisomo Reply
how to calculate actual output?
Chisomo
how to calculate the equilibrium income
Beshir
Criteria for determining money supply
Thapase Reply
who we can define macroeconomics in one line
Muhammad
Aggregate demand
Mohammed
C=k100 +9y and i=k50.calculate the equilibrium level of output
Mercy Reply
Hi
Isiaka
Hi
Geli
hy
Man
👋
Bahunda
hy how are you?
Man
ys
Amisha
how are you guys
Sekou
f9 guys
Amisha
how are you guys
Sekou
ys am also fine
Amisha
fine and you guys
Geli
from Nepal
Amisha
nawalparasi district from belatari
Amisha
nd u
Amisha
I am Camara from Guinea west Africa... happy to meet you guys here
Sekou
ma management ho
Amisha
ahile becheclor ho
Amisha
hjr ktm bta ho ani k kaam grnu hunxa tw
Amisha
belatari
Amisha
1st year ho
Amisha
nd u
Amisha
ahh
Amisha
kaha biratnagar
Amisha
ys
Amisha
kina k vo
Amisha
money as unit of account means what?
Kalombe
A unit of account is something that can be used to value goods and services and make calculations
Jim
all of you please speak in English I can't understand you're language
Muhammad
I want to know how can we define macroeconomics in one line
Muhammad
it must be .9 or 0.9 no Mpc is greater than 1 Y=100+.9Y+50 Y-.9Y=150 0.1Y/0.1=150/0.1 Y=1500
Kalombe
Mercy is it clear?😋
Kalombe
hi can someone help me on this question If a negative shocks shifts the IS curve to the left, what type of policy do you suggest so as to stabilize the level of output? discuss your answer using appropriate graph.
Galge Reply
if interest rate is increased this will will reduce the level of income shifting the curve to the left ◀️
Kalombe
Got questions? Join the online conversation and get instant answers!
Jobilize.com Reply

Get Jobilize Job Search Mobile App in your pocket Now!

Get it on Google Play Download on the App Store Now


Source:  OpenStax, Principles of economics. OpenStax CNX. Sep 19, 2014 Download for free at http://legacy.cnx.org/content/col11613/1.11
Google Play and the Google Play logo are trademarks of Google Inc.

Notification Switch

Would you like to follow the 'Principles of economics' conversation and receive update notifications?

Ask