<< Chapter < Page Chapter >> Page >

By the end of this section, you will be able to:

  • Explain the U.S. federal budget in terms of annual debt and accumulated debt
  • Understand how economic growth or decline can influence a budget surplus or budget deficit

Having discussed the revenue (taxes) and expense (spending) side of the budget, we now turn to the annual budget deficit or surplus, which is the difference between the tax revenue collected and spending over a fiscal year, which starts October 1 and ends September 30 of the next year.

[link] shows the pattern of annual federal budget deficits and surpluses, back to 1930, as a share of GDP. When the line is above the horizontal axis, the budget is in surplus; when the line is below the horizontal axis, a budget deficit occurred. Clearly, the biggest deficits as a share of GDP during this time were incurred to finance World War II. Deficits were also large during the 1930s, the 1980s, the early 1990s, and most recently during the recession of 2008–2009.
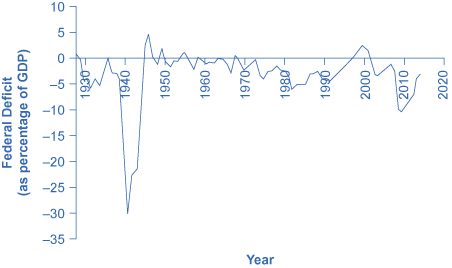
Pattern of federal budget deficits and surpluses, 1929–2014

The graph shows that federal deficit (as a percentage of GDP) skyrocketed between the late 1930s and mid-1940s. In 2009, it was around –10%. In 2014, the federal deficit was close to –3%.
The federal government has run budget deficits for decades. The budget was briefly in surplus in the late 1990s, before heading into deficit again in the first decade of the 2000s—and especially deep deficits in the recession of 2008–2009. (Source: Federal Reserve Bank of St. Louis (FRED). http://research.stlouisfed.org/fred2/series/FYFSGDA188S)

Debt/gdp ratio

Another useful way to view the budget deficit is through the prism of accumulated debt rather than annual deficits. The national debt    refers to the total amount that the government has borrowed over time; in contrast, the budget deficit refers to how much has been borrowed in one particular year. [link] shows the ratio of debt/GDP since 1940. Until the 1970s, the debt/GDP ratio revealed a fairly clear pattern of federal borrowing. The government ran up large deficits and raised the debt/GDP ratio in World War II, but from the 1950s to the 1970s the government ran either surpluses or relatively small deficits, and so the debt/GDP ratio drifted down. Large deficits in the 1980s and early 1990s caused the ratio to rise sharply. When budget surpluses arrived from 1998 to 2001, the debt/GDP ratio declined substantially. The budget deficits starting in 2002 then tugged the debt/GDP ratio higher—with a big jump when the recession took hold in 2008–2009.
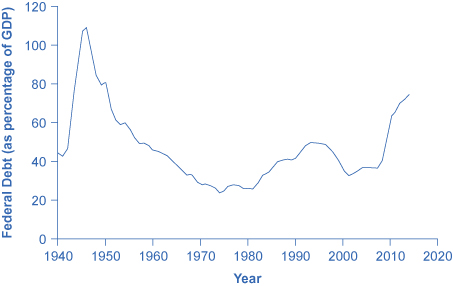
Federal debt as a percentage of gdp, 1942–2014

The graph shows that federal debt (as a percentage of GDP) was highest in the late 1940s before steadily declining down beneath 30% in the mid-1970s. Another increase took place during the recession in 2009 where it rose to over 60% and has been rising steadily since.
Federal debt is the sum of annual budget deficits and surpluses. Annual deficits do not always mean that the debt/GDP ratio is rising. During the 1960s and 1970s, the government often ran small deficits, but since the debt was growing more slowly than the economy, the debt/GDP ratio was declining over this time. In the 2008–2009 recession, the debt/GDP ratio rose sharply. (Source: Economic Report of the President, Table B-20, http://www.gpo.gov/fdsys/pkg/ERP-2015/content-detail.html)

The next Clear it Up feature discusses how the government handles the national debt.

What is the national debt?

One year’s federal budget deficit causes the federal government to sell Treasury bonds to make up the difference between spending programs and tax revenues. The dollar value of all the outstanding Treasury bonds on which the federal government owes money is equal to the national debt.

Questions & Answers

Three charges q_{1}=+3\mu C, q_{2}=+6\mu C and q_{3}=+8\mu C are located at (2,0)m (0,0)m and (0,3) coordinates respectively. Find the magnitude and direction acted upon q_{2} by the two other charges.Draw the correct graphical illustration of the problem above showing the direction of all forces.
Kate Reply
To solve this problem, we need to first find the net force acting on charge q_{2}. The magnitude of the force exerted by q_{1} on q_{2} is given by F=\frac{kq_{1}q_{2}}{r^{2}} where k is the Coulomb constant, q_{1} and q_{2} are the charges of the particles, and r is the distance between them.
Muhammed
What is the direction and net electric force on q_{1}= 5µC located at (0,4)r due to charges q_{2}=7mu located at (0,0)m and q_{3}=3\mu C located at (4,0)m?
Kate Reply
what is the change in momentum of a body?
Eunice Reply
what is a capacitor?
Raymond Reply
Capacitor is a separation of opposite charges using an insulator of very small dimension between them. Capacitor is used for allowing an AC (alternating current) to pass while a DC (direct current) is blocked.
Gautam
A motor travelling at 72km/m on sighting a stop sign applying the breaks such that under constant deaccelerate in the meters of 50 metres what is the magnitude of the accelerate
Maria Reply
please solve
Sharon
8m/s²
Aishat
What is Thermodynamics
Muordit
velocity can be 72 km/h in question. 72 km/h=20 m/s, v^2=2.a.x , 20^2=2.a.50, a=4 m/s^2.
Mehmet
A boat travels due east at a speed of 40meter per seconds across a river flowing due south at 30meter per seconds. what is the resultant speed of the boat
Saheed Reply
50 m/s due south east
Someone
which has a higher temperature, 1cup of boiling water or 1teapot of boiling water which can transfer more heat 1cup of boiling water or 1 teapot of boiling water explain your . answer
Ramon Reply
I believe temperature being an intensive property does not change for any amount of boiling water whereas heat being an extensive property changes with amount/size of the system.
Someone
Scratch that
Someone
temperature for any amount of water to boil at ntp is 100⁰C (it is a state function and and intensive property) and it depends both will give same amount of heat because the surface available for heat transfer is greater in case of the kettle as well as the heat stored in it but if you talk.....
Someone
about the amount of heat stored in the system then in that case since the mass of water in the kettle is greater so more energy is required to raise the temperature b/c more molecules of water are present in the kettle
Someone
definitely of physics
Haryormhidey Reply
how many start and codon
Esrael Reply
what is field
Felix Reply
physics, biology and chemistry this is my Field
ALIYU
field is a region of space under the influence of some physical properties
Collete
what is ogarnic chemistry
WISDOM Reply
determine the slope giving that 3y+ 2x-14=0
WISDOM
Another formula for Acceleration
Belty Reply
a=v/t. a=f/m a
IHUMA
innocent
Adah
pratica A on solution of hydro chloric acid,B is a solution containing 0.5000 mole ofsodium chlorid per dm³,put A in the burret and titrate 20.00 or 25.00cm³ portion of B using melting orange as the indicator. record the deside of your burret tabulate the burret reading and calculate the average volume of acid used?
Nassze Reply
how do lnternal energy measures
Esrael
Two bodies attract each other electrically. Do they both have to be charged? Answer the same question if the bodies repel one another.
JALLAH Reply
No. According to Isac Newtons law. this two bodies maybe you and the wall beside you. Attracting depends on the mass och each body and distance between them.
Dlovan
Are you really asking if two bodies have to be charged to be influenced by Coulombs Law?
Robert
like charges repel while unlike charges atttact
Raymond
What is specific heat capacity
Destiny Reply
Specific heat capacity is a measure of the amount of energy required to raise the temperature of a substance by one degree Celsius (or Kelvin). It is measured in Joules per kilogram per degree Celsius (J/kg°C).
AI-Robot
specific heat capacity is the amount of energy needed to raise the temperature of a substance by one degree Celsius or kelvin
ROKEEB
Got questions? Join the online conversation and get instant answers!
Jobilize.com Reply

Get Jobilize Job Search Mobile App in your pocket Now!

Get it on Google Play Download on the App Store Now


Source:  OpenStax, Macroeconomics. OpenStax CNX. Jun 16, 2014 Download for free at http://legacy.cnx.org/content/col11626/1.10
Google Play and the Google Play logo are trademarks of Google Inc.

Notification Switch

Would you like to follow the 'Macroeconomics' conversation and receive update notifications?

Ask