<< Chapter < Page Chapter >> Page >

By the end of this section, you will be able to:

  • Explain the U.S. federal budget in terms of annual debt and accumulated debt
  • Understand how economic growth or decline can influence a budget surplus or budget deficit

Having discussed the revenue (taxes) and expense (spending) side of the budget, we now turn to the annual budget deficit or surplus, which is the difference between the tax revenue collected and spending over a fiscal year, which starts October 1 and ends September 30 of the next year.

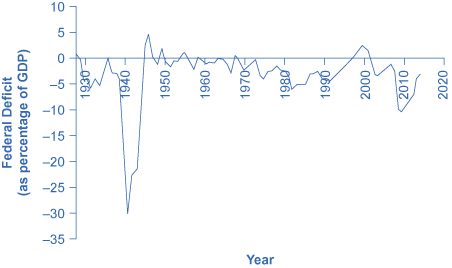
[link] shows the pattern of annual federal budget deficits and surpluses, back to 1930, as a share of GDP. When the line is above the horizontal axis, the budget is in surplus; when the line is below the horizontal axis, a budget deficit occurred. Clearly, the biggest deficits as a share of GDP during this time were incurred to finance World War II. Deficits were also large during the 1930s, the 1980s, the early 1990s, and most recently during the recession of 2008–2009.

Pattern of federal budget deficits and surpluses, 1929–2014

The graph shows that federal deficit (as a percentage of GDP) skyrocketed between the late 1930s and mid-1940s. In 2009, it was around –10%. In 2014, the federal deficit was close to –3%.
The federal government has run budget deficits for decades. The budget was briefly in surplus in the late 1990s, before heading into deficit again in the first decade of the 2000s—and especially deep deficits in the recession of 2008–2009. (Source: Federal Reserve Bank of St. Louis (FRED). http://research.stlouisfed.org/fred2/series/FYFSGDA188S)

Debt/gdp ratio

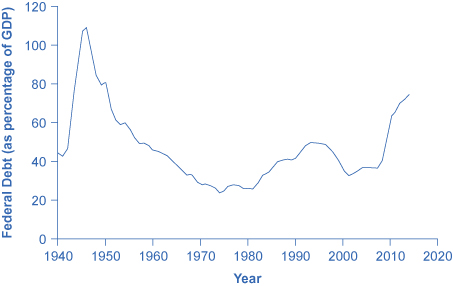
Another useful way to view the budget deficit is through the prism of accumulated debt rather than annual deficits. The national debt    refers to the total amount that the government has borrowed over time; in contrast, the budget deficit refers to how much has been borrowed in one particular year. [link] shows the ratio of debt/GDP since 1940. Until the 1970s, the debt/GDP ratio revealed a fairly clear pattern of federal borrowing. The government ran up large deficits and raised the debt/GDP ratio in World War II, but from the 1950s to the 1970s the government ran either surpluses or relatively small deficits, and so the debt/GDP ratio drifted down. Large deficits in the 1980s and early 1990s caused the ratio to rise sharply. When budget surpluses arrived from 1998 to 2001, the debt/GDP ratio declined substantially. The budget deficits starting in 2002 then tugged the debt/GDP ratio higher—with a big jump when the recession took hold in 2008–2009.

Federal debt as a percentage of gdp, 1942–2014

The graph shows that federal debt (as a percentage of GDP) was highest in the late 1940s before steadily declining down beneath 30% in the mid-1970s. Another increase took place during the recession in 2009 where it rose to over 60% and has been rising steadily since.
Federal debt is the sum of annual budget deficits and surpluses. Annual deficits do not always mean that the debt/GDP ratio is rising. During the 1960s and 1970s, the government often ran small deficits, but since the debt was growing more slowly than the economy, the debt/GDP ratio was declining over this time. In the 2008–2009 recession, the debt/GDP ratio rose sharply. (Source: Economic Report of the President, Table B-20, http://www.gpo.gov/fdsys/pkg/ERP-2015/content-detail.html)

The next Clear it Up feature discusses how the government handles the national debt.

What is the national debt?

One year’s federal budget deficit causes the federal government to sell Treasury bonds to make up the difference between spending programs and tax revenues. The dollar value of all the outstanding Treasury bonds on which the federal government owes money is equal to the national debt.

Questions & Answers

Ayele, K., 2003. Introductory Economics, 3rd ed., Addis Ababa.
Widad Reply
can you send the book attached ?
Ariel
?
Ariel
What is economics
Widad Reply
the study of how humans make choices under conditions of scarcity
AI-Robot
U(x,y) = (x×y)1/2 find mu of x for y
Desalegn Reply
U(x,y) = (x×y)1/2 find mu of x for y
Desalegn
what is ecnomics
Jan Reply
this is the study of how the society manages it's scarce resources
Belonwu
what is macroeconomic
John Reply
macroeconomic is the branch of economics which studies actions, scale, activities and behaviour of the aggregate economy as a whole.
husaini
etc
husaini
difference between firm and industry
husaini Reply
what's the difference between a firm and an industry
Abdul
firm is the unit which transform inputs to output where as industry contain combination of firms with similar production 😅😅
Abdulraufu
Suppose the demand function that a firm faces shifted from Qd  120 3P to Qd  90  3P and the supply function has shifted from QS  20  2P to QS 10  2P . a) Find the effect of this change on price and quantity. b) Which of the changes in demand and supply is higher?
Toofiq Reply
explain standard reason why economic is a science
innocent Reply
factors influencing supply
Petrus Reply
what is economic.
Milan Reply
scares means__________________ends resources. unlimited
Jan
economics is a science that studies human behaviour as a relationship b/w ends and scares means which have alternative uses
Jan
calculate the profit maximizing for demand and supply
Zarshad Reply
Why qualify 28 supplies
Milan
what are explicit costs
Nomsa Reply
out-of-pocket costs for a firm, for example, payments for wages and salaries, rent, or materials
AI-Robot
concepts of supply in microeconomics
David Reply
economic overview notes
Amahle Reply
identify a demand and a supply curve
Salome Reply
i don't know
Parul
there's a difference
Aryan
Demand curve shows that how supply and others conditions affect on demand of a particular thing and what percent demand increase whith increase of supply of goods
Israr
Hi Sir please how do u calculate Cross elastic demand and income elastic demand?
Abari
Got questions? Join the online conversation and get instant answers!
Jobilize.com Reply

Get Jobilize Job Search Mobile App in your pocket Now!

Get it on Google Play Download on the App Store Now


Source:  OpenStax, Macroeconomics. OpenStax CNX. Jun 16, 2014 Download for free at http://legacy.cnx.org/content/col11626/1.10
Google Play and the Google Play logo are trademarks of Google Inc.

Notification Switch

Would you like to follow the 'Macroeconomics' conversation and receive update notifications?

Ask