<< Chapter < Page Chapter >> Page >

(This appendix should be consulted after first reading The Aggregate Demand/Aggregate Supply Model and The Keynesian Perspective .) The fundamental ideas of Keynesian economics were developed before the AD/AS model was popularized. From the 1930s until the 1970s, Keynesian economics was usually explained with a different model, known as the expenditure-output approach. This approach is strongly rooted in the fundamental assumptions of Keynesian economics: it focuses on the total amount of spending in the economy, with no explicit mention of aggregate supply or of the price level (although as you will see, it is possible to draw some inferences about aggregate supply and price levels based on the diagram).

The axes of the expenditure-output diagram

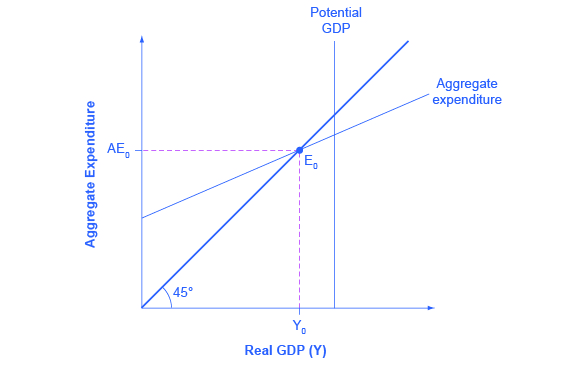
The expenditure-output model , sometimes also called the Keynesian cross diagram , determines the equilibrium level of real GDP by the point where the total or aggregate expenditures in the economy are equal to the amount of output produced. The axes of the Keynesian cross diagram presented in [link] show real GDP on the horizontal axis as a measure of output and aggregate expenditures on the vertical axis as a measure of spending.

The expenditure-output diagram

The graph shows the aggregate expenditure-output diagram. The x-axis is labeled “real GDP” and the y-axis is labeled aggregate expenditure. An upward sloping 45 degree line extends from the origin and intersects with the aggregate expenditure line at point E sub 0. Potential GDP is a straight vertical line.
The aggregate expenditure-output model shows aggregate expenditures on the vertical axis and real GDP on the horizontal axis. A vertical line shows potential GDP where full employment occurs. The 45-degree line shows all points where aggregate expenditures and output are equal. The aggregate expenditure schedule shows how total spending or aggregate expenditure increases as output or real GDP rises. The intersection of the aggregate expenditure schedule and the 45-degree line will be the equilibrium. Equilibrium occurs at E 0 , where aggregate expenditure AE 0 is equal to the output level Y 0 .

Remember that GDP can be thought of in several equivalent ways: it measures both the value of spending on final goods and also the value of the production of final goods. All sales of the final goods and services that make up GDP will eventually end up as income for workers, for managers, and for investors and owners of firms. The sum of all the income received for contributing resources to GDP is called national income (Y). At some points in the discussion that follows, it will be useful to refer to real GDP as “national income.” Both axes are measured in real (inflation-adjusted) terms.

The Potential GDP Line and the 45-degree Line

The Keynesian cross diagram contains two lines that serve as conceptual guideposts to orient the discussion. The first is a vertical line showing the level of potential GDP . Potential GDP means the same thing here that it means in the AD/AS diagrams: it refers to the quantity of output that the economy can produce with full employment of its labor and physical capital.

The second conceptual line on the Keynesian cross diagram is the 45-degree line, which starts at the origin and reaches up and to the right. A line that stretches up at a 45-degree angle represents the set of points (1, 1), (2, 2), (3, 3) and so on, where the measurement on the vertical axis is equal to the measurement on the horizontal axis. In this diagram, the 45-degree line shows the set of points where the level of aggregate expenditure in the economy, measured on the vertical axis, is equal to the level of output or national income in the economy, measured by GDP on the horizontal axis.

Questions & Answers

Why is b in the answer
Dahsolar Reply
how do you work it out?
Brad Reply
answer
Ernest
heheheehe
Nitin
(Pcos∅+qsin∅)/(pcos∅-psin∅)
John Reply
how to do that?
Rosemary Reply
what is it about?
Amoah
how to answer the activity
Chabelita Reply
how to solve the activity
Chabelita
solve for X,,4^X-6(2^)-16=0
Alieu Reply
x4xminus 2
Lominate
sobhan Singh jina uniwarcity tignomatry ka long answers tile questions
harish Reply
t he silly nut company makes two mixtures of nuts: mixture a and mixture b. a pound of mixture a contains 12 oz of peanuts, 3 oz of almonds and 1 oz of cashews and sells for $4. a pound of mixture b contains 12 oz of peanuts, 2 oz of almonds and 2 oz of cashews and sells for $5. the company has 1080
ZAHRO Reply
If  , , are the roots of the equation 3 2 0, x px qx r     Find the value of 1  .
Swetha Reply
Parts of a pole were painted red, blue and yellow. 3/5 of the pole was red and 7/8 was painted blue. What part was painted yellow?
Patrick Reply
Parts of the pole was painted red, blue and yellow. 3 /5 of the pole was red and 7 /8 was painted blue. What part was painted yellow?
Patrick
how I can simplify algebraic expressions
Katleho Reply
Lairene and Mae are joking that their combined ages equal Sam’s age. If Lairene is twice Mae’s age and Sam is 69 yrs old, what are Lairene’s and Mae’s ages?
Mary Reply
23yrs
Yeboah
lairenea's age is 23yrs
ACKA
hy
Katleho
Ello everyone
Katleho
Laurene is 46 yrs and Mae is 23 is
Solomon
hey people
christopher
age does not matter
christopher
solve for X, 4^x-6(2*)-16=0
Alieu
prove`x^3-3x-2cosA=0 (-π<A<=π
Mayank Reply
create a lesson plan about this lesson
Rose Reply
Excusme but what are you wrot?
Got questions? Join the online conversation and get instant answers!
Jobilize.com Reply

Get Jobilize Job Search Mobile App in your pocket Now!

Get it on Google Play Download on the App Store Now


Source:  OpenStax, Macroeconomics. OpenStax CNX. Jun 16, 2014 Download for free at http://legacy.cnx.org/content/col11626/1.10
Google Play and the Google Play logo are trademarks of Google Inc.

Notification Switch

Would you like to follow the 'Macroeconomics' conversation and receive update notifications?

Ask