

| << Chapter < Page | Chapter >> Page > |
One result of the new breakdown of work processes was that factory owners were able to hire women and children to perform many of the tasks. From 1870 through 1900, the number of women working outside the home tripled. By the end of this period, five million American women were wage earners, with one-quarter of them working factory jobs. Most were young, under twenty-five, and either immigrants themselves or the daughters of immigrants. Their foray into the working world was not seen as a step towards empowerment or equality, but rather a hardship born of financial necessity. Women’s factory work tended to be in clothing or textile factories, where their appearance was less offensive to men who felt that heavy industry was their purview. Other women in the workforce worked in clerical positions as bookkeepers and secretaries, and as salesclerks. Not surprisingly, women were paid less than men, under the pretense that they should be under the care of a man and did not require a living wage.
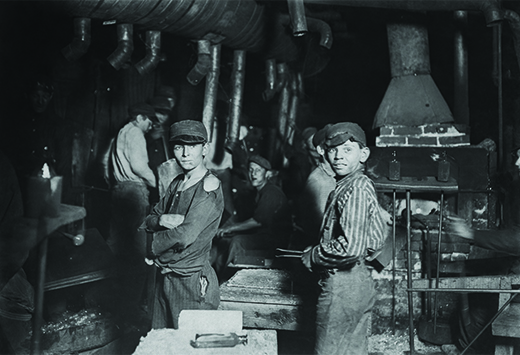
Factory owners used the same rationale for the exceedingly low wages they paid to children. Children were small enough to fit easily among the machines and could be hired for simple work for a fraction of an adult man’s pay. The image below ( [link] ) shows children working the night shift in a glass factory. From 1870 through 1900, child labor in factories tripled. Growing concerns among progressive reformers over the safety of women and children in the workplace would eventually result in the development of political lobby groups. Several states passed legislative efforts to ensure a safe workplace, and the lobby groups pressured Congress to pass protective legislation. However, such legislation would not be forthcoming until well into the twentieth century. In the meantime, many working-class immigrants still desired the additional wages that child and women labor produced, regardless of the harsh working conditions.
Workers were well aware of the vast discrepancy between their lives and the wealth of the factory owners. Lacking the assets and legal protection needed to organize, and deeply frustrated, some working communities erupted in spontaneous violence. The coal mines of eastern Pennsylvania and the railroad yards of western Pennsylvania, central to both respective industries and home to large, immigrant, working enclaves, saw the brunt of these outbursts. The combination of violence, along with several other factors, blunted any significant efforts to organize workers until well into the twentieth century.
Business owners viewed organization efforts with great mistrust, capitalizing upon widespread anti-union sentiment among the general public to crush unions through open shops, the use of strikebreakers, yellow-dog contracts (in which the employee agrees to not join a union as a pre-condition of employment), and other means. Workers also faced obstacles to organization associated with race and ethnicity, as questions arose on how to address the increasing number of low-paid African American workers, in addition to the language and cultural barriers introduced by the large wave of southeastern European immigration to the United States. But in large part, the greatest obstacle to effective unionization was the general public’s continued belief in a strong work ethic and that an individual work ethic—not organizing into radical collectives—would reap its own rewards. As violence erupted, such events seemed only to confirm widespread popular sentiment that radical, un-American elements were behind all union efforts.
Notification Switch
Would you like to follow the 'U.s. history' conversation and receive update notifications?

|
|
|
|
|
|
|
|

|
|

|
|

|
|

|
|

|
|

|
|

|
|

|
|
|
|