

| << Chapter < Page | Chapter >> Page > |
Seeking comfort in a strange land, as well as a common language, many immigrants sought out relatives, friends, former neighbors, townspeople, and countrymen who had already settled in American cities. This led to a rise in ethnic enclaves within the larger city. Little Italy, Chinatown, and many other communities developed in which immigrant groups could find everything to remind them of home, from local language newspapers to ethnic food stores. While these enclaves provided a sense of community to their members, they added to the problems of urban congestion, particularly in the poorest slums where immigrants could afford housing.
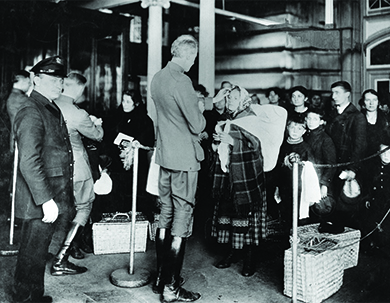
This Library of Congress exhibit on the history of Jewish immigration to the United States illustrates the ongoing challenge immigrants felt between the ties to their old land and a love for America.
The demographic shift at the turn of the century was later confirmed by the Dillingham Commission, created by Congress in 1907 to report on the nature of immigration in America; the commission reinforced this ethnic identification of immigrants and their simultaneous discrimination. The report put it simply: These newer immigrants looked and acted differently. They had darker skin tone, spoke languages with which most Americans were unfamiliar, and practiced unfamiliar religions, specifically Judaism and Catholicism. Even the foods they sought out at butchers and grocery stores set immigrants apart. Because of these easily identifiable differences, new immigrants became easy targets for hatred and discrimination. If jobs were hard to find, or if housing was overcrowded, it became easy to blame the immigrants. Like African Americans, immigrants in cities were blamed for the problems of the day.
Growing numbers of Americans resented the waves of new immigrants, resulting in a backlash. The Reverend Josiah Strong fueled the hatred and discrimination in his bestselling book, Our Country: Its Possible Future and Its Present Crisis , published in 1885. In a revised edition that reflected the 1890 census records, he clearly identified undesirable immigrants—those from southern and eastern European countries—as a key threat to the moral fiber of the country, and urged all good Americans to face the challenge. Several thousand Americans answered his call by forming the American Protective Association, the chief political activist group to promote legislation curbing immigration into the United States. The group successfully lobbied Congress to adopt both an English language literacy test for immigrants, which eventually passed in 1917, and the Chinese Exclusion Act (discussed in a previous chapter). The group’s political lobbying also laid the groundwork for the subsequent Emergency Quota Act of 1921 and the Immigration Act of 1924, as well as the National Origins Act.
The global timeline of immigration at the Library of Congress offers a summary of immigration policies and the groups affected by it, as well as a compelling overview of different ethnic groups’ immigration stories. Browse through to see how different ethnic groups made their way in the United States.
For both African Americans migrating from the postwar South and immigrants arriving from southeastern Europe, a combination of “push” and “pull” factors influenced their migration to America’s urban centers. African Americans moved away from the racial violence and limited opportunities that existed in the rural South, seeking wages and steady work, as well as the opportunity to vote safely as free men; however, they quickly learned that racial discrimination and violence were not limited to the South. For European immigrants, famine and persecution led them to seek a new life in the United States, where, the stories said, the streets were paved in gold. Of course, in northeastern and midwestern cities, both groups found a more challenging welcome than they had anticipated. City residents blamed recent arrivals for the ills of the cities, from overcrowding to a rise in crime. Activist groups pushed for anti-immigration legislation, seeking to limit the waves of immigrants that sought a better future in the United States.
Notification Switch
Would you like to follow the 'U.s. history' conversation and receive update notifications?

|
|

|
|

|
|

|
|

|
|

|
|

|
|

|
|

|
|

|
|

|