<< Chapter < Page Chapter >> Page >

Even after it became apparent that heterosexuals could contract the disease through blood transfusions and heterosexual intercourse, HIV/AIDS continued to be associated primarily with the gay community, especially by political and religious conservatives. Indeed, the Religious Right regarded it as a form of divine retribution meant to punish gay men for their “immoral” lifestyle. President Reagan, always politically careful, was reluctant to speak openly about the developing crisis even as thousands faced certain death from the disease.

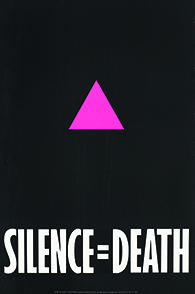
With little help coming from the government, the gay community quickly began to organize its own response. In 1982, New York City men formed the Gay Men’s Health Crisis (GMHC), a volunteer organization that operated an information hotline, provided counseling and legal assistance, and raised money for people with HIV/AIDS. Larry Kramer, one of the original members, left in 1983 and formed his own organization, the AIDS Coalition to Unleash Power (ACT UP), in 1987. ACT UP took a more militant approach, holding demonstrations on Wall Street, outside the U.S. Food and Drug Administration (FDA), and inside the New York Stock Exchange to call attention and shame the government into action. One of the images adopted by the group, a pink triangle paired with the phrase “Silence = Death,” captured media attention and quickly became the symbol of the AIDS crisis ( [link] ).

A graphic features a pink triangle on a black background. At the bottom are the words “SILENCE = DEATH.”
The pink triangle was originally used in Nazi concentration camps to identify those there for acts of homosexuality. Reclaimed by gay activists in New York as a symbol of resistance and solidarity during the 1970s, it was further transformed as a symbol of governmental inaction in the face of the AIDS epidemic during the 1980s.

The war on drugs and the road to mass incarceration

As Ronald Reagan took office in 1981, violent crime in the United States was reaching an all-time high. While there were different reasons for the spike, the most important one was demographics: The primary category of offenders, males between the ages of sixteen and thirty-six, reached an all-time peak as the baby-boomer generation came of age. But the phenomenon that most politicians honed in on as a cause for violent crime was the abuse of a new, cheap drug dealt illegally on city streets. Crack cocaine, a smokable type of cocaine popular with poorer addicts, was hitting the streets in the 1980s, frightening middle-class Americans. Reagan and other conservatives led a campaign to “get tough on crime” and promised the nation a “ war on drugs    .” Initiatives like the “Just Say No” campaign led by First Lady Nancy Reagan implied that drug addiction and drug-related crime reflected personal morality.

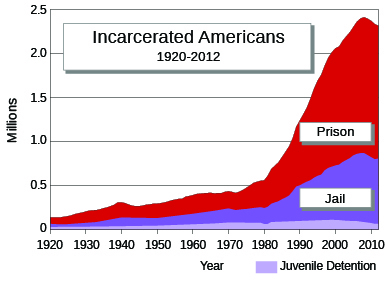
Nixon had first used the term in 1971, but in the 1980s the “war on drugs” took on an ominous dimension, as politicians scrambled over each other to enact harsher sentences for drug offenses so they could market themselves as tough on crime. State after state switched from variable to mandatory minimum sentences that were exceedingly long and particularly harsh for street drug crimes. The federal government supported the trend with federal sentencing guidelines and additional funds for local law enforcement agencies. This law-and-order movement peaked in the 1990s, when California introduced a “three strikes” law that mandated life imprisonment without parole for any third felony conviction—even nonviolent ones. As a result, prisons became crowded, and states went deep into debt to build more. By the end of the century, the war began to die down as the public lost interest in the problem, the costs of the punishment binge became politically burdensome, and scholars and politicians began to advocate the decriminalization of drug use. By this time, however, hundreds of thousands of people had been incarcerated for drug offenses and the total number of prisoners in the nation had grown four-fold in the last quarter of the century. Particularly glaring were the racial inequities of the new age of mass incarceration, with African Americans being seven times more likely to be in prison ( [link] ).

A graph labeled “Incarcerated Americans, 1920–2012” shows, in millions, the numbers of people incarcerated in prison, jail, or juvenile detention facilities. The numbers trend slightly upward from 1920–1980 and then climb steeply.
This graph of the number of people in jail, prison, and juvenile detention by decade in the United States shows the huge increase in incarceration during the war on drugs that began in the 1980s, during the Reagan administration. (Prisons are long-term state or federal facilities; jails are local, short-term facilities.)

Section summary

The political conservatism of the 1980s and 1990s was matched by the social conservatism of the period. Conservative politicians wished to limit the size and curb the power of the federal government. Conservative think tanks flourished, the Christian Right defeated the ERA, and bipartisan efforts to add warning labels to explicit music lyrics were the subject of Congressional hearings. HIV/AIDS, which became chiefly and inaccurately associated with the gay community, grew to crisis proportions, as heterosexuals and the federal government failed to act. In response, gay men organized advocacy groups to fight for research on HIV/AIDS. Meanwhile, the so-called war on drugs began a get-tough trend in law enforcement that mandated lengthy sentences for drug-related offenses and hugely increased the American prison population.

Questions & Answers

differentiate between demand and supply giving examples
Lambiv Reply
differentiated between demand and supply using examples
Lambiv
what is labour ?
Lambiv
how will I do?
Venny Reply
how is the graph works?I don't fully understand
Rezat Reply
information
Eliyee
devaluation
Eliyee
t
WARKISA
hi guys good evening to all
Lambiv
multiple choice question
Aster Reply
appreciation
Eliyee
explain perfect market
Lindiwe Reply
In economics, a perfect market refers to a theoretical construct where all participants have perfect information, goods are homogenous, there are no barriers to entry or exit, and prices are determined solely by supply and demand. It's an idealized model used for analysis,
Ezea
What is ceteris paribus?
Shukri Reply
other things being equal
AI-Robot
When MP₁ becomes negative, TP start to decline. Extuples Suppose that the short-run production function of certain cut-flower firm is given by: Q=4KL-0.6K2 - 0.112 • Where is quantity of cut flower produced, I is labour input and K is fixed capital input (K-5). Determine the average product of lab
Kelo
Extuples Suppose that the short-run production function of certain cut-flower firm is given by: Q=4KL-0.6K2 - 0.112 • Where is quantity of cut flower produced, I is labour input and K is fixed capital input (K-5). Determine the average product of labour (APL) and marginal product of labour (MPL)
Kelo
yes,thank you
Shukri
Can I ask you other question?
Shukri
what is monopoly mean?
Habtamu Reply
What is different between quantity demand and demand?
Shukri Reply
Quantity demanded refers to the specific amount of a good or service that consumers are willing and able to purchase at a give price and within a specific time period. Demand, on the other hand, is a broader concept that encompasses the entire relationship between price and quantity demanded
Ezea
ok
Shukri
how do you save a country economic situation when it's falling apart
Lilia Reply
what is the difference between economic growth and development
Fiker Reply
Economic growth as an increase in the production and consumption of goods and services within an economy.but Economic development as a broader concept that encompasses not only economic growth but also social & human well being.
Shukri
production function means
Jabir
What do you think is more important to focus on when considering inequality ?
Abdisa Reply
any question about economics?
Awais Reply
sir...I just want to ask one question... Define the term contract curve? if you are free please help me to find this answer 🙏
Asui
it is a curve that we get after connecting the pareto optimal combinations of two consumers after their mutually beneficial trade offs
Awais
thank you so much 👍 sir
Asui
In economics, the contract curve refers to the set of points in an Edgeworth box diagram where both parties involved in a trade cannot be made better off without making one of them worse off. It represents the Pareto efficient allocations of goods between two individuals or entities, where neither p
Cornelius
In economics, the contract curve refers to the set of points in an Edgeworth box diagram where both parties involved in a trade cannot be made better off without making one of them worse off. It represents the Pareto efficient allocations of goods between two individuals or entities,
Cornelius
Suppose a consumer consuming two commodities X and Y has The following utility function u=X0.4 Y0.6. If the price of the X and Y are 2 and 3 respectively and income Constraint is birr 50. A,Calculate quantities of x and y which maximize utility. B,Calculate value of Lagrange multiplier. C,Calculate quantities of X and Y consumed with a given price. D,alculate optimum level of output .
Feyisa Reply
Answer
Feyisa
c
Jabir
the market for lemon has 10 potential consumers, each having an individual demand curve p=101-10Qi, where p is price in dollar's per cup and Qi is the number of cups demanded per week by the i th consumer.Find the market demand curve using algebra. Draw an individual demand curve and the market dema
Gsbwnw Reply
suppose the production function is given by ( L, K)=L¼K¾.assuming capital is fixed find APL and MPL. consider the following short run production function:Q=6L²-0.4L³ a) find the value of L that maximizes output b)find the value of L that maximizes marginal product
Abdureman
types of unemployment
Yomi Reply
What is the difference between perfect competition and monopolistic competition?
Mohammed
Got questions? Join the online conversation and get instant answers!
Jobilize.com Reply

Get Jobilize Job Search Mobile App in your pocket Now!

Get it on Google Play Download on the App Store Now


Source:  OpenStax, U.s. history. OpenStax CNX. Jan 12, 2015 Download for free at http://legacy.cnx.org/content/col11740/1.3
Google Play and the Google Play logo are trademarks of Google Inc.

Notification Switch

Would you like to follow the 'U.s. history' conversation and receive update notifications?

Ask