<< Chapter < Page Chapter >> Page >
A painting presents a bucolic, romantic depiction of the Erie Canal and its environs. A single vessel is present on the water, and a man conducts several horses alongside the canal. A city is barely visible in the background.
Although the Erie Canal was primarily used for commerce and trade, in Pittsford on the Erie Canal (1837), George Harvey portrays it in a pastoral, natural setting. Why do you think the painter chose to portray the canal this way?

Explore the Erie Canal on ErieCanal.org via an interactive map. Click throughout the map for images of and artifacts from this historic waterway.

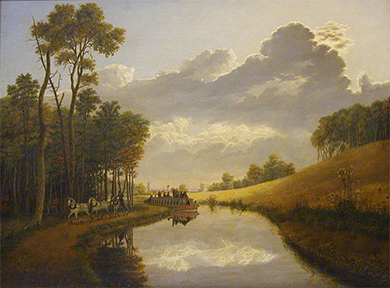
The success of the Erie Canal led to other, similar projects. The Wabash and Erie Canal, which opened in the early 1840s, stretched over 450 miles, making it the longest canal in North America ( [link] ). Canals added immensely to the country’s sense of progress. Indeed, they appeared to be the logical next step in the process of transforming wilderness into civilization.

Map (a) shows the route taken by the Wabash and Erie Canal through the state of Indiana. Photograph (b) shows a portion of the Erie Canal in 2007.
This map (a) shows the route taken by the Wabash and Erie Canal through the state of Indiana. The canal began operation in 1843 and boats operated on it until the 1870s. Sections have since been restored, as shown in this 2007 photo (b) from Delphi, Indiana.

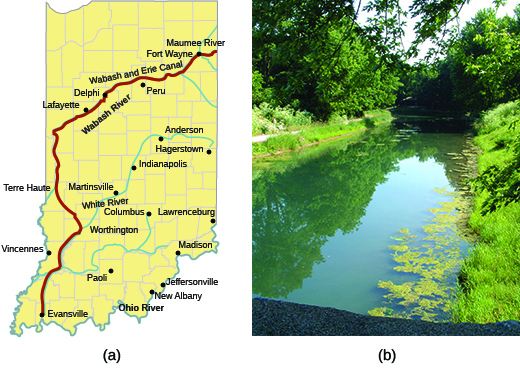
Visit Southern Indiana Trails to see historic photographs of the Wabash and Erie Canal:

As with highway projects such as the Cumberland Road, many canals were federally sponsored, especially during the presidency of John Quincy Adams in the late 1820s. Adams, along with Secretary of State Henry Clay, championed what was known as the American System, part of which included plans for a broad range of internal transportation improvements. Adams endorsed the creation of roads and canals to facilitate commerce and develop markets for agriculture as well as to advance settlement in the West.

Railroads

Starting in the late 1820s, steam locomotives began to compete with horse-drawn locomotives. The railroads with steam locomotives offered a new mode of transportation that fascinated citizens, buoying their optimistic view of the possibilities of technological progress. The Mohawk and Hudson Railroad    was the first to begin service with a steam locomotive. Its inaugural train ran in 1831 on a track outside Albany and covered twelve miles in twenty-five minutes. Soon it was traveling regularly between Albany and Schenectady.

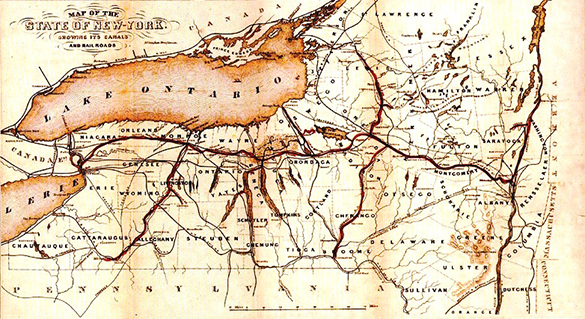
Toward the middle of the century, railroad construction kicked into high gear, and eager investors quickly formed a number of railroad companies. As a railroad grid began to take shape, it stimulated a greater demand for coal, iron, and steel. Soon, both railroads and canals crisscrossed the states ( [link] ), providing a transportation infrastructure that fueled the growth of American commerce. Indeed, the transportation revolution led to development in the coal, iron, and steel industries, providing many Americans with new job opportunities.

An 1853 map of New York State shows its extensive networks of railroads and canals.
This 1853 map of the “Empire State” shows the extent of New York’s canal and railroad networks. The entire country’s transportation infrastructure grew dramatically during the first half of the nineteenth century.

Americans on the move

The expansion of roads, canals, and railroads changed people’s lives. In 1786, it had taken a minimum of four days to travel from Boston, Massachusetts, to Providence, Rhode Island. By 1840, the trip took half a day on a train. In the twenty-first century, this may seem intolerably slow, but people at the time were amazed by the railroad’s speed. Its average of twenty miles per hour was twice as fast as other available modes of transportation.

By 1840, more than three thousand miles of canals had been dug in the United States, and thirty thousand miles of railroad track had been laid by the beginning of the Civil War. Together with the hundreds of steamboats that plied American rivers, these advances in transportation made it easier and less expensive to ship agricultural products from the West to feed people in eastern cities, and to send manufactured goods from the East to people in the West. Without this ability to transport goods, the market revolution would not have been possible. Rural families also became less isolated as a result of the transportation revolution. Traveling circuses, menageries, peddlers, and itinerant painters could now more easily make their way into rural districts, and people in search of work found cities and mill towns within their reach.

Section summary

A transportation infrastructure rapidly took shape in the 1800s as American investors and the government began building roads, turnpikes, canals, and railroads. The time required to travel shrank vastly, and people marveled at their ability to conquer great distances, enhancing their sense of the steady advance of progress. The transportation revolution also made it possible to ship agricultural and manufactured goods throughout the country and enabled rural people to travel to towns and cities for employment opportunities.

Questions & Answers

What are the factors that affect demand for a commodity
Florence Reply
differentiate between demand and supply giving examples
Lambiv Reply
differentiated between demand and supply using examples
Lambiv
what is labour ?
Lambiv
how will I do?
Venny Reply
how is the graph works?I don't fully understand
Rezat Reply
information
Eliyee
devaluation
Eliyee
t
WARKISA
hi guys good evening to all
Lambiv
multiple choice question
Aster Reply
appreciation
Eliyee
explain perfect market
Lindiwe Reply
In economics, a perfect market refers to a theoretical construct where all participants have perfect information, goods are homogenous, there are no barriers to entry or exit, and prices are determined solely by supply and demand. It's an idealized model used for analysis,
Ezea
What is ceteris paribus?
Shukri Reply
other things being equal
AI-Robot
When MP₁ becomes negative, TP start to decline. Extuples Suppose that the short-run production function of certain cut-flower firm is given by: Q=4KL-0.6K2 - 0.112 • Where is quantity of cut flower produced, I is labour input and K is fixed capital input (K-5). Determine the average product of lab
Kelo
Extuples Suppose that the short-run production function of certain cut-flower firm is given by: Q=4KL-0.6K2 - 0.112 • Where is quantity of cut flower produced, I is labour input and K is fixed capital input (K-5). Determine the average product of labour (APL) and marginal product of labour (MPL)
Kelo
yes,thank you
Shukri
Can I ask you other question?
Shukri
what is monopoly mean?
Habtamu Reply
What is different between quantity demand and demand?
Shukri Reply
Quantity demanded refers to the specific amount of a good or service that consumers are willing and able to purchase at a give price and within a specific time period. Demand, on the other hand, is a broader concept that encompasses the entire relationship between price and quantity demanded
Ezea
ok
Shukri
how do you save a country economic situation when it's falling apart
Lilia Reply
what is the difference between economic growth and development
Fiker Reply
Economic growth as an increase in the production and consumption of goods and services within an economy.but Economic development as a broader concept that encompasses not only economic growth but also social & human well being.
Shukri
production function means
Jabir
What do you think is more important to focus on when considering inequality ?
Abdisa Reply
any question about economics?
Awais Reply
sir...I just want to ask one question... Define the term contract curve? if you are free please help me to find this answer 🙏
Asui
it is a curve that we get after connecting the pareto optimal combinations of two consumers after their mutually beneficial trade offs
Awais
thank you so much 👍 sir
Asui
In economics, the contract curve refers to the set of points in an Edgeworth box diagram where both parties involved in a trade cannot be made better off without making one of them worse off. It represents the Pareto efficient allocations of goods between two individuals or entities, where neither p
Cornelius
In economics, the contract curve refers to the set of points in an Edgeworth box diagram where both parties involved in a trade cannot be made better off without making one of them worse off. It represents the Pareto efficient allocations of goods between two individuals or entities,
Cornelius
Suppose a consumer consuming two commodities X and Y has The following utility function u=X0.4 Y0.6. If the price of the X and Y are 2 and 3 respectively and income Constraint is birr 50. A,Calculate quantities of x and y which maximize utility. B,Calculate value of Lagrange multiplier. C,Calculate quantities of X and Y consumed with a given price. D,alculate optimum level of output .
Feyisa Reply
Answer
Feyisa
c
Jabir
the market for lemon has 10 potential consumers, each having an individual demand curve p=101-10Qi, where p is price in dollar's per cup and Qi is the number of cups demanded per week by the i th consumer.Find the market demand curve using algebra. Draw an individual demand curve and the market dema
Gsbwnw Reply
suppose the production function is given by ( L, K)=L¼K¾.assuming capital is fixed find APL and MPL. consider the following short run production function:Q=6L²-0.4L³ a) find the value of L that maximizes output b)find the value of L that maximizes marginal product
Abdureman
Got questions? Join the online conversation and get instant answers!
Jobilize.com Reply

Get Jobilize Job Search Mobile App in your pocket Now!

Get it on Google Play Download on the App Store Now


Source:  OpenStax, U.s. history. OpenStax CNX. Jan 12, 2015 Download for free at http://legacy.cnx.org/content/col11740/1.3
Google Play and the Google Play logo are trademarks of Google Inc.

Notification Switch

Would you like to follow the 'U.s. history' conversation and receive update notifications?

Ask