| << Chapter < Page | Chapter >> Page > |
Even before the official beginning of the war, the country started to prepare. In August 1940, Congress created the Defense Plant Corporation, which had built 344 plants in the West by 1945, and had funneled over $1.8 billion into the economies of western states. After Pearl Harbor, as American military strategists began to plan counterattacks and campaigns against the Axis powers, California became a training ground. Troops trained there for tank warfare and amphibious assaults as well as desert campaigns—since the first assault against the Axis powers was planned for North Africa.
As thousands of Americans swarmed to the West Coast to take jobs in defense plants and shipyards, cities like Richmond, California, and nearby Oakland, expanded quickly. Richmond grew from a city of 20,000 people to 100,000 in only three years. Almost overnight, the population of California skyrocketed. African Americans moved out of the rural South into northern or West Coast cities to provide the muscle and skill to build the machines of war. Building on earlier waves of African American migration after the Civil War and during World War I, the demographics of the nation changed with the growing urbanization of the African American population. Women also relocated to either follow their husbands to military bases or take jobs in the defense industry, as the total mobilization of the national economy began to tap into previously underemployed populations.
Roosevelt and his administration already had experience in establishing government controls and taking the initiative in economic matters during the Depression. In April 1941, Roosevelt created the Office of Price Administration (OPA), and, once the United States entered the war, the OPA regulated prices and attempted to combat inflation. The OPA ultimately had the power to set ceiling prices for all goods, except agricultural commodities, and to ration a long list of items. During the war, major labor unions pledged not to strike in order to prevent disruptions in production; in return, the government encouraged businesses to recognize unions and promised to help workers bargain for better wages.
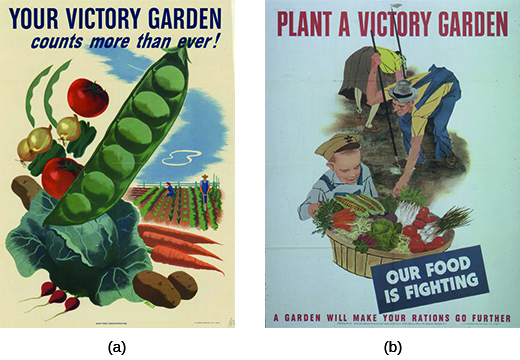
As in World War I, the government turned to bond drives to finance the war. Millions of Americans purchased more than $185 billion worth of war bonds. Children purchased Victory Stamps and exchanged full stamp booklets for bonds. The federal government also instituted the current tax-withholding system to ensure collection of taxes. Finally, the government once again urged Americans to plant victory gardens, using marketing campaigns and celebrities to promote the idea ( [link] ). Americans responded eagerly, planting gardens in their backyards and vacant lots.

The federal government also instituted rationing to ensure that America’s fighting men were well fed. Civilians were issued ration booklets, books of coupons that enabled them to buy limited amounts of meat, coffee, butter, sugar, and other foods. Wartime cookbooks were produced, such as the Betty Crocker cookbook Your Share , telling housewives how to prepare tasty meals without scarce food items. Other items were rationed as well, including shoes, liquor, cigarettes, and gasoline. With a few exceptions, such as doctors, Americans were allowed to drive their automobiles only on certain days of the week. Most Americans complied with these regulations, but some illegally bought and sold rationed goods on the black market.

Notification Switch
Would you like to follow the 'U.s. history' conversation and receive update notifications?