<< Chapter < Page
  U.s. history   Page 1 / 1
Chapter >> Page >
  • Prosperity and the Production of Popular Entertainment
  • Transformation and Backlash
  • A New Generation
  • Republican Ascendancy: Politics in the 1920s
A book cover contains the text “Tales of the Jazz Age: By the Author of The Beautiful and the Damned / F. Scott Fitzgerald.” Two caricatured band members play drums and a trumpet while several caricatured couples dance, smoke, and toast with cocktails.
The illustrations for F. Scott Fitzgerald’s Tales of the Jazz Age , drawn by John Held, Jr., epitomized the carefree flapper era of the 1920s.

Following the hardships of the immediate postwar era, the United States embarked upon one of the most prosperous decades in history. Mass production, especially of the automobile, increased mobility and fostered new industries. Unemployment plummeted as businesses grew to meet this increased demand. Cities continued to grow and, according to the 1920 census, a majority of the population lived in urban areas of twenty-five hundred or more residents.

Jazz music, movies, speakeasies, and new dances dominated the urban evening scene. Recent immigrants from southern and eastern Europe, many of them Catholic, now participated in the political system. This challenged rural Protestant fundamentalism, even as quota laws sought to limit new immigration patterns. The Ku Klux Klan rose to greater power, as they protested not only the changing role of African Americans but also the growing population of immigrant, Catholic, and Jewish Americans.

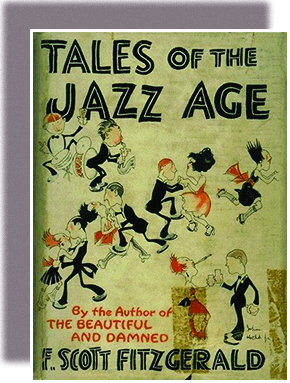
This mixture of social, political, economic, and cultural change and conflict gave the decade the nickname the “Roaring Twenties” or the “Jazz Age.” The above illustration ( [link] ), which graced the cover of F. Scott Fitzgerald’s Tales of the Jazz Age , embodies the popular view of the 1920s as a nonstop party, replete with dancing, music, flappers, and illegal drinking.

Questions & Answers

how do you get the 2/50
Abba Reply
number of sport play by 50 student construct discrete data
Aminu Reply
width of the frangebany leaves on how to write a introduction
Theresa Reply
Solve the mean of variance
Veronica Reply
Step 1: Find the mean. To find the mean, add up all the scores, then divide them by the number of scores. ... Step 2: Find each score's deviation from the mean. ... Step 3: Square each deviation from the mean. ... Step 4: Find the sum of squares. ... Step 5: Divide the sum of squares by n – 1 or N.
kenneth
what is error
Yakuba Reply
Is mistake done to something
Vutshila
Hy
anas
hy
What is the life teble
anas
hy
Jibrin
statistics is the analyzing of data
Tajudeen Reply
what is statics?
Zelalem Reply
how do you calculate mean
Gloria Reply
diveving the sum if all values
Shaynaynay
let A1,A2 and A3 events be independent,show that (A1)^c, (A2)^c and (A3)^c are independent?
Fisaye Reply
what is statistics
Akhisani Reply
data collected all over the world
Shaynaynay
construct a less than and more than table
Imad Reply
The sample of 16 students is taken. The average age in the sample was 22 years with astandard deviation of 6 years. Construct a 95% confidence interval for the age of the population.
Aschalew Reply
Bhartdarshan' is an internet-based travel agency wherein customer can see videos of the cities they plant to visit. The number of hits daily is a normally distributed random variable with a mean of 10,000 and a standard deviation of 2,400 a. what is the probability of getting more than 12,000 hits? b. what is the probability of getting fewer than 9,000 hits?
Akshay Reply
Bhartdarshan'is an internet-based travel agency wherein customer can see videos of the cities they plan to visit. The number of hits daily is a normally distributed random variable with a mean of 10,000 and a standard deviation of 2,400. a. What is the probability of getting more than 12,000 hits
Akshay
1
Bright
Sorry i want to learn more about this question
Bright
Someone help
Bright
a= 0.20233 b=0.3384
Sufiyan
a
Shaynaynay
How do I interpret level of significance?
Mohd Reply
It depends on your business problem or in Machine Learning you could use ROC- AUC cruve to decide the threshold value
Shivam
how skewness and kurtosis are used in statistics
Owen Reply
yes what is it
Taneeya
Got questions? Join the online conversation and get instant answers!
Jobilize.com Reply

Get Jobilize Job Search Mobile App in your pocket Now!

Get it on Google Play Download on the App Store Now


Source:  OpenStax, U.s. history. OpenStax CNX. Jan 12, 2015 Download for free at http://legacy.cnx.org/content/col11740/1.3
Google Play and the Google Play logo are trademarks of Google Inc.

Notification Switch

Would you like to follow the 'U.s. history' conversation and receive update notifications?

Ask