<< Chapter < Page
  U.s. history   Page 1 / 1
Chapter >> Page >
  • Portuguese Exploration and Spanish Conquest
  • Religious Upheavals in the Developing Atlantic World
  • Challenges to Spain’s Supremacy
  • New Worlds in the Americas: Labor, Commerce, and the Columbian Exchange
A woodcut shows King Ferdinand of Spain as a crowned, robed ruler seated on a throne, surrounded by land and sea. He points across the Atlantic, where Columbus lands with three large ships. A large group of Indians is shown on the shore.
After Christopher Columbus “discovered” the New World, he sent letters home to Spain describing the wonders he beheld. These letters were quickly circulated throughout Europe and translated into Italian, German, and Latin. This woodcut is from the first Italian verse translation of the letter Columbus sent to the Spanish court after his first voyage, Lettera delle isole novamente trovata by Giuliano Dati.

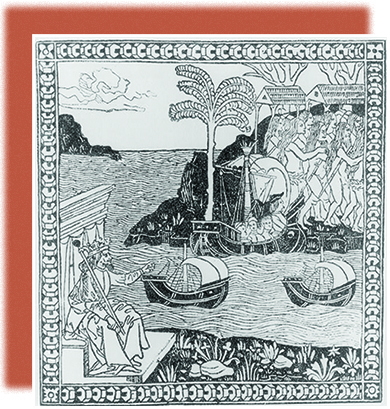
The story of the Atlantic World is the story of global migration, a migration driven in large part by the actions and aspirations of the ruling heads of Europe. Columbus is hardly visible in this illustration of his ships making landfall on the Caribbean island of Hispaniola ( [link] ). Instead, Ferdinand II of Spain (in the foreground) sits on his throne and points toward Columbus’s landing. As the ships arrive, the Arawak people tower over the Spanish, suggesting the native population density of the islands.

This historic moment in 1492 sparked new rivalries among European powers as they scrambled to create New World colonies, fueled by the quest for wealth and power as well as by religious passions. Almost continuous war resulted. Spain achieved early preeminence, creating a far-flung empire and growing rich with treasures from the Americas. Native Americans who confronted the newcomers from Europe suffered unprecedented losses of life, however, as previously unknown diseases sliced through their populations. They also were victims of the arrogance of the Europeans, who viewed themselves as uncontested masters of the New World, sent by God to bring Christianity to the “Indians.”

Questions & Answers

how do you get the 2/50
Abba Reply
number of sport play by 50 student construct discrete data
Aminu Reply
width of the frangebany leaves on how to write a introduction
Theresa Reply
Solve the mean of variance
Veronica Reply
Step 1: Find the mean. To find the mean, add up all the scores, then divide them by the number of scores. ... Step 2: Find each score's deviation from the mean. ... Step 3: Square each deviation from the mean. ... Step 4: Find the sum of squares. ... Step 5: Divide the sum of squares by n – 1 or N.
kenneth
what is error
Yakuba Reply
Is mistake done to something
Vutshila
Hy
anas
hy
What is the life teble
anas
hy
Jibrin
statistics is the analyzing of data
Tajudeen Reply
what is statics?
Zelalem Reply
how do you calculate mean
Gloria Reply
diveving the sum if all values
Shaynaynay
let A1,A2 and A3 events be independent,show that (A1)^c, (A2)^c and (A3)^c are independent?
Fisaye Reply
what is statistics
Akhisani Reply
data collected all over the world
Shaynaynay
construct a less than and more than table
Imad Reply
The sample of 16 students is taken. The average age in the sample was 22 years with astandard deviation of 6 years. Construct a 95% confidence interval for the age of the population.
Aschalew Reply
Bhartdarshan' is an internet-based travel agency wherein customer can see videos of the cities they plant to visit. The number of hits daily is a normally distributed random variable with a mean of 10,000 and a standard deviation of 2,400 a. what is the probability of getting more than 12,000 hits? b. what is the probability of getting fewer than 9,000 hits?
Akshay Reply
Bhartdarshan'is an internet-based travel agency wherein customer can see videos of the cities they plan to visit. The number of hits daily is a normally distributed random variable with a mean of 10,000 and a standard deviation of 2,400. a. What is the probability of getting more than 12,000 hits
Akshay
1
Bright
Sorry i want to learn more about this question
Bright
Someone help
Bright
a= 0.20233 b=0.3384
Sufiyan
a
Shaynaynay
How do I interpret level of significance?
Mohd Reply
It depends on your business problem or in Machine Learning you could use ROC- AUC cruve to decide the threshold value
Shivam
how skewness and kurtosis are used in statistics
Owen Reply
yes what is it
Taneeya
Got questions? Join the online conversation and get instant answers!
Jobilize.com Reply

Get Jobilize Job Search Mobile App in your pocket Now!

Get it on Google Play Download on the App Store Now


Source:  OpenStax, U.s. history. OpenStax CNX. Jan 12, 2015 Download for free at http://legacy.cnx.org/content/col11740/1.3
Google Play and the Google Play logo are trademarks of Google Inc.

Notification Switch

Would you like to follow the 'U.s. history' conversation and receive update notifications?

Ask