<< Chapter < Page
  U.s. history   Page 1 / 1
Chapter >> Page >
  • Common Sense: From Monarchy to an American Republic
  • How Much Revolutionary Change?
  • Debating Democracy
  • The Constitutional Convention and Federal Constitution
A painting shows George Washington standing on a promontory above the Hudson River, wearing a military coat and holding a tricorner hat and sword in his hand. Just behind Washington, his slave William “Billy” Lee, a black man wearing a red, turban-like hat, holds a horse and watches Washington. In the far background, British warships fire on an American fort.
John Trumbull, Washington’s aide-de-camp, painted this wartime image of Washington on a promontory above the Hudson River. Just behind Washington, his slave William “Billy” Lee has his eyes firmly fixed on his master. In the far background, British warships fire on an American fort.

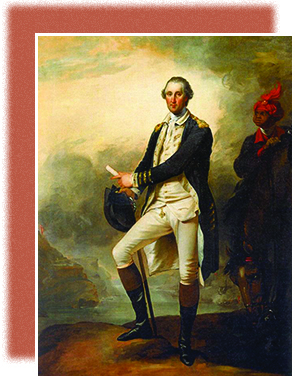
After the Revolutionary War, the ideology that “all men are created equal” failed to match up with reality, as the revolutionary generation could not solve the contradictions of freedom and slavery in the new United States. Trumbull’s 1780 painting of George Washington ( [link] ) hints at some of these contradictions. What attitude do you think Trumbull was trying to convey? Why did Trumbull include Washington’s slave Billy Lee, and what does Lee represent in this painting?

During the 1770s and 1780s, Americans took bold steps to define American equality. Each state held constitutional conventions and crafted state constitutions that defined how government would operate and who could participate in political life. Many elite revolutionaries recoiled in horror from the idea of majority rule—the basic principle of democracy—fearing that it would effectively create a “mob rule” that would bring about the ruin of the hard-fought struggle for independence. Statesmen everywhere believed that a republic should replace the British monarchy: a government where the important affairs would be entrusted only to representative men of learning and refinement.

Questions & Answers

how do you get the 2/50
Abba Reply
number of sport play by 50 student construct discrete data
Aminu Reply
width of the frangebany leaves on how to write a introduction
Theresa Reply
Solve the mean of variance
Veronica Reply
Step 1: Find the mean. To find the mean, add up all the scores, then divide them by the number of scores. ... Step 2: Find each score's deviation from the mean. ... Step 3: Square each deviation from the mean. ... Step 4: Find the sum of squares. ... Step 5: Divide the sum of squares by n – 1 or N.
kenneth
what is error
Yakuba Reply
Is mistake done to something
Vutshila
Hy
anas
hy
What is the life teble
anas
hy
Jibrin
statistics is the analyzing of data
Tajudeen Reply
what is statics?
Zelalem Reply
how do you calculate mean
Gloria Reply
diveving the sum if all values
Shaynaynay
let A1,A2 and A3 events be independent,show that (A1)^c, (A2)^c and (A3)^c are independent?
Fisaye Reply
what is statistics
Akhisani Reply
data collected all over the world
Shaynaynay
construct a less than and more than table
Imad Reply
The sample of 16 students is taken. The average age in the sample was 22 years with astandard deviation of 6 years. Construct a 95% confidence interval for the age of the population.
Aschalew Reply
Bhartdarshan' is an internet-based travel agency wherein customer can see videos of the cities they plant to visit. The number of hits daily is a normally distributed random variable with a mean of 10,000 and a standard deviation of 2,400 a. what is the probability of getting more than 12,000 hits? b. what is the probability of getting fewer than 9,000 hits?
Akshay Reply
Bhartdarshan'is an internet-based travel agency wherein customer can see videos of the cities they plan to visit. The number of hits daily is a normally distributed random variable with a mean of 10,000 and a standard deviation of 2,400. a. What is the probability of getting more than 12,000 hits
Akshay
1
Bright
Sorry i want to learn more about this question
Bright
Someone help
Bright
a= 0.20233 b=0.3384
Sufiyan
a
Shaynaynay
How do I interpret level of significance?
Mohd Reply
It depends on your business problem or in Machine Learning you could use ROC- AUC cruve to decide the threshold value
Shivam
how skewness and kurtosis are used in statistics
Owen Reply
yes what is it
Taneeya
Got questions? Join the online conversation and get instant answers!
Jobilize.com Reply

Get Jobilize Job Search Mobile App in your pocket Now!

Get it on Google Play Download on the App Store Now


Source:  OpenStax, U.s. history. OpenStax CNX. Jan 12, 2015 Download for free at http://legacy.cnx.org/content/col11740/1.3
Google Play and the Google Play logo are trademarks of Google Inc.

Notification Switch

Would you like to follow the 'U.s. history' conversation and receive update notifications?

Ask