<< Chapter < Page
  U.s. history   Page 1 / 1
Chapter >> Page >
  • The Kennedy Promise
  • Lyndon Johnson and the Great Society
  • The Civil Rights Movement Marches On
  • Challenging the Status Quo
A painting of John F. Kennedy shows the president standing with his arms folded, staring downward.
In Aaron Shikler’s official portrait of John Fitzgerald Kennedy (1970), the president stands with arms folded, apparently deep in thought. The portrait was painted seven years after Kennedy’s death, at the request of his widow, Jacqueline Kennedy Onassis. It depicts the president with his head down, because Shikler did not wish to paint the dead man’s eyes.

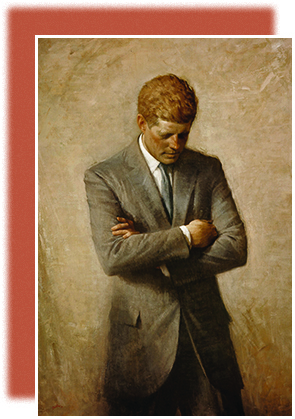
The 1960s was a decade of hope, change, and war that witnessed an important shift in American culture. Citizens from all walks of life sought to expand the meaning of the American promise. Their efforts helped unravel the national consensus and laid bare a far more fragmented society. As a result, men and women from all ethnic groups attempted to reform American society to make it more equitable. The United States also began to take unprecedented steps to exert what it believed to be a positive influence on the world. At the same time, the country’s role in Vietnam revealed the limits of military power and the contradictions of U.S. foreign policy. The posthumous portrait of John F. Kennedy ( [link] ) captures this mix of the era’s promise and defeat. His election encouraged many to work for a better future, for both the middle class and the marginalized. Kennedy’s running mate, Lyndon B. Johnson, also envisioned a country characterized by the social and economic freedoms established during the New Deal years. Kennedy’s assassination in 1963, and the assassinations five years later of Martin Luther King, Jr. and Robert F. Kennedy, made it dramatically clear that not all Americans shared this vision of a more inclusive democracy.

Questions & Answers

how do you get the 2/50
Abba Reply
number of sport play by 50 student construct discrete data
Aminu Reply
width of the frangebany leaves on how to write a introduction
Theresa Reply
Solve the mean of variance
Veronica Reply
Step 1: Find the mean. To find the mean, add up all the scores, then divide them by the number of scores. ... Step 2: Find each score's deviation from the mean. ... Step 3: Square each deviation from the mean. ... Step 4: Find the sum of squares. ... Step 5: Divide the sum of squares by n – 1 or N.
kenneth
what is error
Yakuba Reply
Is mistake done to something
Vutshila
Hy
anas
hy
What is the life teble
anas
hy
Jibrin
statistics is the analyzing of data
Tajudeen Reply
what is statics?
Zelalem Reply
how do you calculate mean
Gloria Reply
diveving the sum if all values
Shaynaynay
let A1,A2 and A3 events be independent,show that (A1)^c, (A2)^c and (A3)^c are independent?
Fisaye Reply
what is statistics
Akhisani Reply
data collected all over the world
Shaynaynay
construct a less than and more than table
Imad Reply
The sample of 16 students is taken. The average age in the sample was 22 years with astandard deviation of 6 years. Construct a 95% confidence interval for the age of the population.
Aschalew Reply
Bhartdarshan' is an internet-based travel agency wherein customer can see videos of the cities they plant to visit. The number of hits daily is a normally distributed random variable with a mean of 10,000 and a standard deviation of 2,400 a. what is the probability of getting more than 12,000 hits? b. what is the probability of getting fewer than 9,000 hits?
Akshay Reply
Bhartdarshan'is an internet-based travel agency wherein customer can see videos of the cities they plan to visit. The number of hits daily is a normally distributed random variable with a mean of 10,000 and a standard deviation of 2,400. a. What is the probability of getting more than 12,000 hits
Akshay
1
Bright
Sorry i want to learn more about this question
Bright
Someone help
Bright
a= 0.20233 b=0.3384
Sufiyan
a
Shaynaynay
How do I interpret level of significance?
Mohd Reply
It depends on your business problem or in Machine Learning you could use ROC- AUC cruve to decide the threshold value
Shivam
how skewness and kurtosis are used in statistics
Owen Reply
yes what is it
Taneeya
Got questions? Join the online conversation and get instant answers!
Jobilize.com Reply

Get Jobilize Job Search Mobile App in your pocket Now!

Get it on Google Play Download on the App Store Now


Source:  OpenStax, U.s. history. OpenStax CNX. Jan 12, 2015 Download for free at http://legacy.cnx.org/content/col11740/1.3
Google Play and the Google Play logo are trademarks of Google Inc.

Notification Switch

Would you like to follow the 'U.s. history' conversation and receive update notifications?

Ask