<< Chapter < Page Chapter >> Page >
By the end of this section, you will be able to:
  • Explain the labor-intensive processes of cotton production
  • Describe the importance of cotton to the Atlantic and American antebellum economy
A timeline shows important events of the era. In 1794, Eli Whitney patents the cotton gin; an illustration of slaves using a cotton gin is shown. In 1803, the U.S. purchases Louisiana Territory from France; a painting depicting the raising of the U.S. flag in the main plaza of New Orleans is shown. In 1811, Charles Deslondes leads a slave revolt in Louisiana. In 1831, Nat Turner leads a slave rebellion; an illustration of Nat Turner’s capture is shown. In 1845, the United States annexes Texas; a contemporaneous map of the United States is shown. In 1850, John C. Calhoun’s “Disquisition on Government” is published. In 1852, Harriet Beecher Stowe publishes Uncle Tom’s Cabin; an illustration from Uncle Tom’s Cabin is shown. In 1854, the Ostend Manifesto is made public. In 1855, William Walker conquers Nicaragua and legalizes slavery.

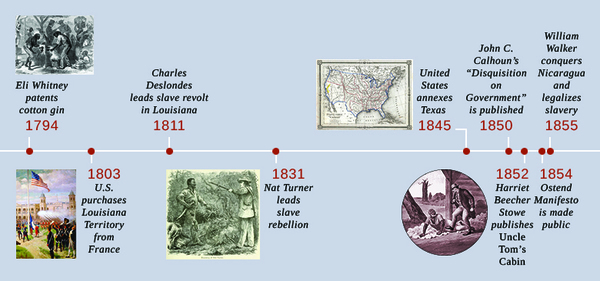
In the antebellum    era—that is, in the years before the Civil War—American planters in the South continued to grow Chesapeake tobacco and Carolina rice as they had in the colonial era. Cotton, however, emerged as the antebellum South’s major commercial crop, eclipsing tobacco, rice, and sugar in economic importance. By 1860, the region was producing two-thirds of the world’s cotton. In 1793, Eli Whitney revolutionized the production of cotton when he invented the cotton gin    , a device that separated the seeds from raw cotton. Suddenly, a process that was extraordinarily labor-intensive when done by hand could be completed quickly and easily. American plantation owners, who were searching for a successful staple crop to compete on the world market, found it in cotton.

As a commodity, cotton had the advantage of being easily stored and transported. A demand for it already existed in the industrial textile mills in Great Britain, and in time, a steady stream of slave-grown American cotton would also supply northern textile mills. Southern cotton, picked and processed by American slaves, helped fuel the nineteenth-century Industrial Revolution in both the United States and Great Britain.

King cotton

Almost no cotton was grown in the United States in 1787, the year the federal constitution was written. However, following the War of 1812, a huge increase in production resulted in the so-called cotton boom    , and by midcentury, cotton became the key cash crop    (a crop grown to sell rather than for the farmer’s sole use) of the southern economy and the most important American commodity. By 1850, of the 3.2 million slaves in the country’s fifteen slave states, 1.8 million were producing cotton; by 1860, slave labor was producing over two billion pounds of cotton per year. Indeed, American cotton soon made up two-thirds of the global supply, and production continued to soar. By the time of the Civil War, South Carolina politician James Hammond confidently proclaimed that the North could never threaten the South because “cotton is king.”

The crop grown in the South was a hybrid: Gossypium barbadense , known as Petit Gulf cotton, a mix of Mexican, Georgia, and Siamese strains. Petit Gulf cotton grew extremely well in different soils and climates. It dominated cotton production in the Mississippi River Valley—home of the new slave states of Louisiana, Mississippi, Arkansas, Tennessee, Kentucky, and Missouri—as well as in other states like Texas. Whenever new slave states entered the Union, white slaveholders sent armies of slaves to clear the land in order to grow and pick the lucrative crop. The phrase “to be sold down the river,” used by Harriet Beecher Stowe in her 1852 novel Uncle Tom’s Cabin , refers to this forced migration from the upper southern states to the Deep South, lower on the Mississippi, to grow cotton.

Questions & Answers

how do you get the 2/50
Abba Reply
number of sport play by 50 student construct discrete data
Aminu Reply
width of the frangebany leaves on how to write a introduction
Theresa Reply
Solve the mean of variance
Veronica Reply
Step 1: Find the mean. To find the mean, add up all the scores, then divide them by the number of scores. ... Step 2: Find each score's deviation from the mean. ... Step 3: Square each deviation from the mean. ... Step 4: Find the sum of squares. ... Step 5: Divide the sum of squares by n – 1 or N.
kenneth
what is error
Yakuba Reply
Is mistake done to something
Vutshila
Hy
anas
hy
What is the life teble
anas
hy
Jibrin
statistics is the analyzing of data
Tajudeen Reply
what is statics?
Zelalem Reply
how do you calculate mean
Gloria Reply
diveving the sum if all values
Shaynaynay
let A1,A2 and A3 events be independent,show that (A1)^c, (A2)^c and (A3)^c are independent?
Fisaye Reply
what is statistics
Akhisani Reply
data collected all over the world
Shaynaynay
construct a less than and more than table
Imad Reply
The sample of 16 students is taken. The average age in the sample was 22 years with astandard deviation of 6 years. Construct a 95% confidence interval for the age of the population.
Aschalew Reply
Bhartdarshan' is an internet-based travel agency wherein customer can see videos of the cities they plant to visit. The number of hits daily is a normally distributed random variable with a mean of 10,000 and a standard deviation of 2,400 a. what is the probability of getting more than 12,000 hits? b. what is the probability of getting fewer than 9,000 hits?
Akshay Reply
Bhartdarshan'is an internet-based travel agency wherein customer can see videos of the cities they plan to visit. The number of hits daily is a normally distributed random variable with a mean of 10,000 and a standard deviation of 2,400. a. What is the probability of getting more than 12,000 hits
Akshay
1
Bright
Sorry i want to learn more about this question
Bright
Someone help
Bright
a= 0.20233 b=0.3384
Sufiyan
a
Shaynaynay
How do I interpret level of significance?
Mohd Reply
It depends on your business problem or in Machine Learning you could use ROC- AUC cruve to decide the threshold value
Shivam
how skewness and kurtosis are used in statistics
Owen Reply
yes what is it
Taneeya
Got questions? Join the online conversation and get instant answers!
Jobilize.com Reply

Get Jobilize Job Search Mobile App in your pocket Now!

Get it on Google Play Download on the App Store Now


Source:  OpenStax, U.s. history. OpenStax CNX. Jan 12, 2015 Download for free at http://legacy.cnx.org/content/col11740/1.3
Google Play and the Google Play logo are trademarks of Google Inc.

Notification Switch

Would you like to follow the 'U.s. history' conversation and receive update notifications?

Ask