

| << Chapter < Page | Chapter >> Page > |
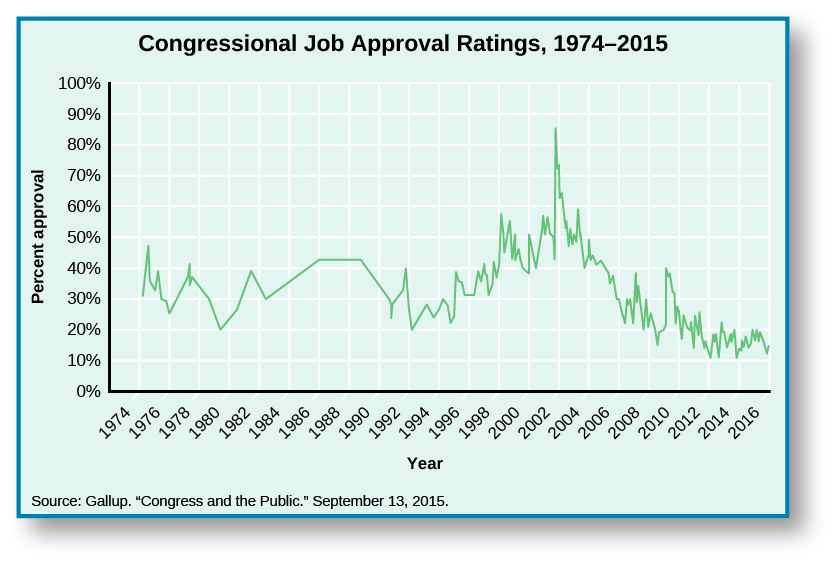
Nevertheless, all things being equal, citizens tend to rate Congress more highly when things get done and more poorly when things do not get done. For example, during the first half of President Obama’s first term, Congress’s approval rating reached a relative high of about 40 percent. Both houses were dominated by members of the president’s own party, and many people were eager for Congress to take action to end the deep recession and begin to repair the economy. Millions were suffering economically, out of work, or losing their jobs, and the idea that Congress was busy passing large stimulus packages, working on finance reform, and grilling unpopular bank CEOs and financial titans appealed to many. Approval began to fade as the Republican Party slowed the wheels of Congress during the tumultuous debates over Obamacare and reached a low of 9 percent following the federal government shutdown in October 2013.
One of the events that began the approval rating’s downward trend was Congress’s divisive debate over national deficits. A deficit is what results when Congress spends more than it has available. It then conducts additional deficit spending by increasing the national debt. Many modern economists contend that during periods of economic decline, the nation should run deficits, because additional government spending has a stimulative effect that can help restart a sluggish economy. Despite this benefit, voters rarely appreciate deficits. They see Congress as spending wastefully during a time when they themselves are cutting costs to get by.
The disconnect between the common public perception of running a deficit and its legitimate policy goals is frequently exploited for political advantage. For example, while running for the presidency in 2008, Barack Obama slammed the deficit spending of the George W. Bush presidency, saying it was “unpatriotic.” This sentiment echoed complaints Democrats had been issuing for years as a weapon against President Bush’s policies. Following the election of President Obama and the Democratic takeover of the Senate, the concern over deficit spending shifted parties, with Republicans championing a spendthrift policy as a way of resisting Democratic policies.
Find your representative at the U.S. House website and then explore his or her website and social media accounts to see whether the issues on which your representative spends time are the ones you think are most appropriate.
Some representatives follow the delegate model of representation, acting on the expressed wishes of their constituents, whereas others take a trustee model approach, acting on what they believe is in their constituents’ best interests. However, most representatives combine the two approaches and apply each as political circumstances demand. The standard method by which representatives have shown their fidelity to their constituents, namely “bringing home the bacon” of favorable budget allocations, has come to be interpreted as a form of corruption, or pork-barrel politics.
Representation can also be considered in other ways. Descriptive representation is the level at which Congress reflects the nation’s constituents in terms of race, ethnicity, gender, sexuality, and socioeconomic status. Collective representation is the extent to which the institutional body of Congress represents the population as a whole. Despite the incumbency advantage and high opinion many hold of their own legislators, Congress rarely earns an approval rating above 40 percent, and for a number of years the rating has been well below 20 percent.
Notification Switch
Would you like to follow the 'American government' conversation and receive update notifications?

|
|

|
|

|
|

|
|

|
|

|
|

|
|

|
|

|
|

|