<< Chapter < Page Chapter >> Page >
Photo of Mitt Romney in front of a crowd, smiling.
Governor and presidential candidate Mitt Romney takes the stage in Boston, Massachusetts, to give his “Super Tuesday” victory speech (credit: modification of work by BU Interactive News/Flickr).

On November 7, 2012, the day after the presidential election, journalists found Mitt Romney’s transition website, detailing the Republican candidate’s plans for the upcoming inauguration celebration and criteria for Cabinet and White House appointees and leaving space for video of his acceptance speech.

Erik Hayden, “Mitt Romney’s Transition Website: Where ‘President-Elect’ Romney Lives On,” Time , 8 November 2012. http://newsfeed.time.com/2012/11/08/mitt-romneys-transition-website-where-president-elect-romney (February 17, 2016).
Yet, Romney had lost his bid for the White House.

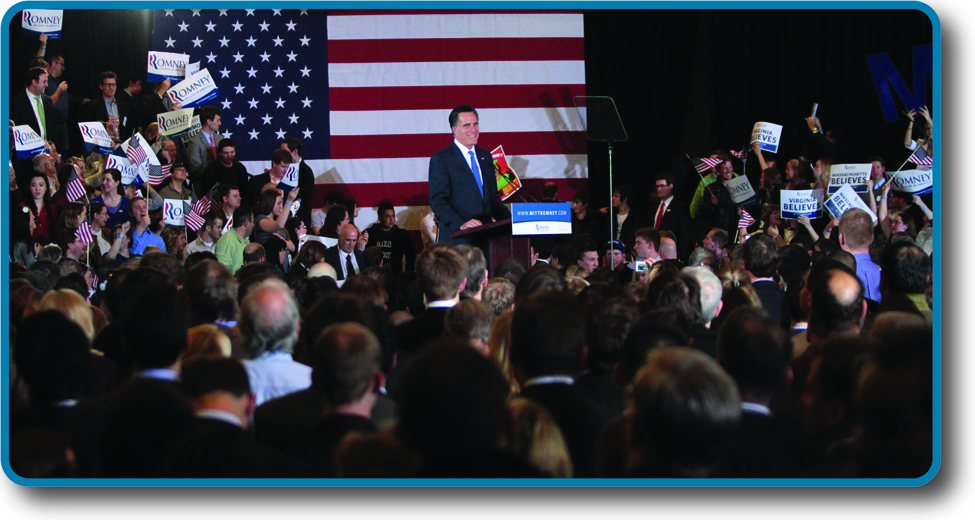
Romney’s campaign staff had been so sure he would win that he had not written a concession speech. How could they have been wrong? Romney’s staff blamed the campaign’s own polls. The staff believed Republican voters were highly motivated, leading Romney pollsters to overestimate how many would turn out ( [link] ).

John Sides, “The Romney Campaign’s Own Polls Showed It Would Lose,” Washington Post , 8 October 2013; Charlie Mahtesian, “Rasmussen Explains,” Politico , 1 November 2012. Jan Crawford, “Adviser: Romney ‘Shellshocked’ by Loss,” CBS News , 8 November 2012.
The campaign’s polls showed Romney close to President Barack Obama, although non-campaign polls showed Obama ahead.
Crawford, “Adviser: Romney ‘Shellshocked’ by Loss.”
On election night, Romney gave his hastily drafted concession speech, still unsure how he had lost.

In the 2016 election, most polls showed Democratic nominee Hillary Clinton with an advantage nationwide and in the battleground states in the days leading up to the election. However, Republican nominee Donald Trump was elected president as many new voters joined the process, voters who were not studied in the polls as likely voters. As many a disappointed candidate knows, public opinion matters. The way opinions are formed and the way we measure public opinion also matter. But how much, and why? These are some of the questions we’ll explore in this chapter.

Questions & Answers

differentiate between demand and supply giving examples
Lambiv Reply
differentiated between demand and supply using examples
Lambiv
what is labour ?
Lambiv
how will I do?
Venny Reply
how is the graph works?I don't fully understand
Rezat Reply
information
Eliyee
devaluation
Eliyee
t
WARKISA
hi guys good evening to all
Lambiv
multiple choice question
Aster Reply
appreciation
Eliyee
explain perfect market
Lindiwe Reply
In economics, a perfect market refers to a theoretical construct where all participants have perfect information, goods are homogenous, there are no barriers to entry or exit, and prices are determined solely by supply and demand. It's an idealized model used for analysis,
Ezea
What is ceteris paribus?
Shukri Reply
other things being equal
AI-Robot
When MP₁ becomes negative, TP start to decline. Extuples Suppose that the short-run production function of certain cut-flower firm is given by: Q=4KL-0.6K2 - 0.112 • Where is quantity of cut flower produced, I is labour input and K is fixed capital input (K-5). Determine the average product of lab
Kelo
Extuples Suppose that the short-run production function of certain cut-flower firm is given by: Q=4KL-0.6K2 - 0.112 • Where is quantity of cut flower produced, I is labour input and K is fixed capital input (K-5). Determine the average product of labour (APL) and marginal product of labour (MPL)
Kelo
yes,thank you
Shukri
Can I ask you other question?
Shukri
what is monopoly mean?
Habtamu Reply
What is different between quantity demand and demand?
Shukri Reply
Quantity demanded refers to the specific amount of a good or service that consumers are willing and able to purchase at a give price and within a specific time period. Demand, on the other hand, is a broader concept that encompasses the entire relationship between price and quantity demanded
Ezea
ok
Shukri
how do you save a country economic situation when it's falling apart
Lilia Reply
what is the difference between economic growth and development
Fiker Reply
Economic growth as an increase in the production and consumption of goods and services within an economy.but Economic development as a broader concept that encompasses not only economic growth but also social & human well being.
Shukri
production function means
Jabir
What do you think is more important to focus on when considering inequality ?
Abdisa Reply
any question about economics?
Awais Reply
sir...I just want to ask one question... Define the term contract curve? if you are free please help me to find this answer 🙏
Asui
it is a curve that we get after connecting the pareto optimal combinations of two consumers after their mutually beneficial trade offs
Awais
thank you so much 👍 sir
Asui
In economics, the contract curve refers to the set of points in an Edgeworth box diagram where both parties involved in a trade cannot be made better off without making one of them worse off. It represents the Pareto efficient allocations of goods between two individuals or entities, where neither p
Cornelius
In economics, the contract curve refers to the set of points in an Edgeworth box diagram where both parties involved in a trade cannot be made better off without making one of them worse off. It represents the Pareto efficient allocations of goods between two individuals or entities,
Cornelius
Suppose a consumer consuming two commodities X and Y has The following utility function u=X0.4 Y0.6. If the price of the X and Y are 2 and 3 respectively and income Constraint is birr 50. A,Calculate quantities of x and y which maximize utility. B,Calculate value of Lagrange multiplier. C,Calculate quantities of X and Y consumed with a given price. D,alculate optimum level of output .
Feyisa Reply
Answer
Feyisa
c
Jabir
the market for lemon has 10 potential consumers, each having an individual demand curve p=101-10Qi, where p is price in dollar's per cup and Qi is the number of cups demanded per week by the i th consumer.Find the market demand curve using algebra. Draw an individual demand curve and the market dema
Gsbwnw Reply
suppose the production function is given by ( L, K)=L¼K¾.assuming capital is fixed find APL and MPL. consider the following short run production function:Q=6L²-0.4L³ a) find the value of L that maximizes output b)find the value of L that maximizes marginal product
Abdureman
types of unemployment
Yomi Reply
What is the difference between perfect competition and monopolistic competition?
Mohammed
Got questions? Join the online conversation and get instant answers!
Jobilize.com Reply

Get Jobilize Job Search Mobile App in your pocket Now!

Get it on Google Play Download on the App Store Now


Source:  OpenStax, American government. OpenStax CNX. Dec 05, 2016 Download for free at http://cnx.org/content/col11995/1.15
Google Play and the Google Play logo are trademarks of Google Inc.

Notification Switch

Would you like to follow the 'American government' conversation and receive update notifications?

Ask