

| << Chapter < Page | Chapter >> Page > |
For better or worse, coverage of the candidates’ statements get less air time on radio and television, and sound bites, or clips, of their speeches have become even shorter. In 1968, the average sound bite from Richard Nixon was 42.3 seconds, while a recent study of television coverage found that sound bites had decreased to only eight seconds in the 2004 election.
Kiku Adatto. May 28, 1990. “The Incredible Shrinking Sound Bite,”
New Republic 202, No. 22: 20–23. The clips chosen to air were attacks on opponents 40 percent of the time. Only 30 percent contained information about the candidate’s issues or events. The study also found the news showed images of the candidates, but for an average of only twenty-five seconds while the newscaster discussed the stories.
Erik Bucy and Maria Elizabeth Grabe. 2007. “Taking Television Seriously: A Sound and Image Bite Analysis of Presidential Campaign Coverage, 1992–2004,”
Journal of Communication 57, No. 4: 652–675.
This study supports the argument that shrinking sound bites are a way for journalists to control the story and add their own analysis rather than just report on it.
Craig Fehrman, “The Incredible Shrinking Sound Bite,”
Boston Globe , 2 January 2011, http://www.boston.com/bostonglobe/ideas/articles/2011/01/02/the_incredible_shrinking_sound_bite/. Candidates are given a few minutes to try to argue their side of an issue, but some say television focuses on the argument rather than on information. In 2004, Jon
Stewart of Comedy Central’s
The Daily Show began attacking the CNN program
Crossfire for being theater, saying the hosts engaged in reactionary and partisan arguing rather than true debating.
“Crossfire: Jon Stewart’s America,”
CNN , 15 October 2004, http://www.cnn.com/TRANSCRIPTS/0410/15/cf.01.html. Some of Stewart’s criticisms resonated, even with host Paul Begala, and
Crossfire was later pulled from the air.
Paul Begala, “Begala: The day Jon Stewart blew up my show,”
CNN , 12 February 2015.
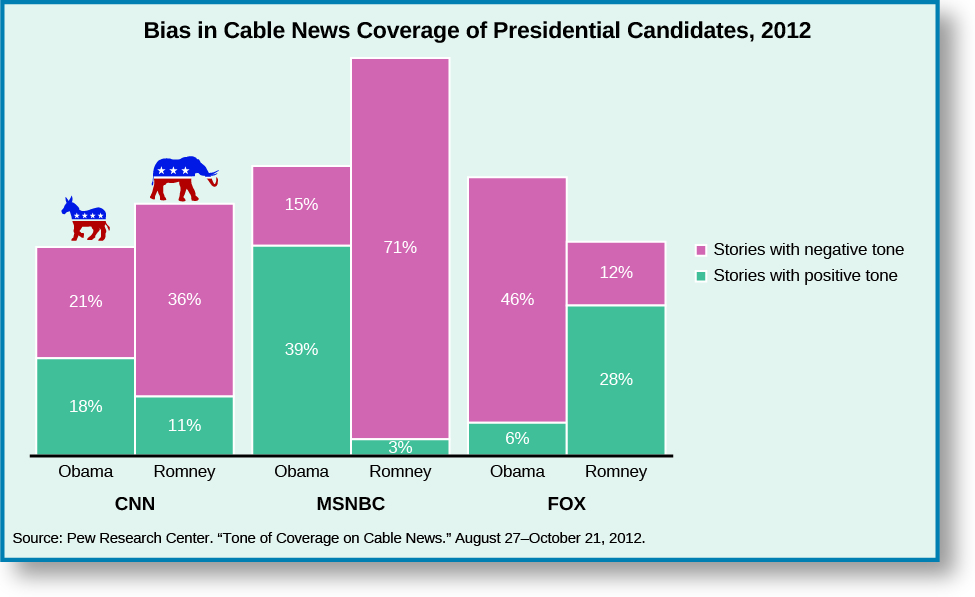
The media’s discussion of campaigns has also grown negative. Although biased campaign coverage dates back to the period of the partisan press, the increase in the number of cable news stations has made the problem more visible. Stations like FOX News and MSNBC are overt in their use of bias in framing stories. During the 2012 campaign, seventy-one of seventy-four MSNBC stories about Mitt Romney were highly negative, while FOX News’ coverage of Obama had forty-six out of fifty-two stories with negative information (
[link] ). The major networks—ABC, CBS, and NBC—were somewhat more balanced, yet the overall coverage of both candidates tended to be negative.
Pew Research Center: Journalism&Media Staff, “Coverage of the Candidates by Media Sector and Cable Outlet,” 1 November 2012.
Due in part to the lack of substantive media coverage, campaigns increasingly use social media to relay their message. Candidates can create their own sites and pages and try to spread news through supporters to the undecided. In 2012, both Romney and Obama maintained Facebook, Twitter, and YouTube accounts to provide information to voters. Yet, on social media, candidates still need to combat negativity, from both the opposition and supporters. Stories about Romney that appeared in the mainstream media were negative 38 percent of the time, while his coverage in Facebook news was negative 62 percent of the time and 58 percent of the time on Twitter.
“Winning the Media Campaign 2012,”
Pew Research Center, 2 November 2012. In the 2016 election cycle, both party nominees heavily used social media. Donald Trump’s scores of tweets became very prominent as he tweeted during Clinton’s convention acceptance speech and sometimes at all hours of the night. Clinton also used Twitter, but less so than Trump, though arguably staying better on message. Trump tended to rail on about topics and at one point was even drawn into a Twitter battle with Senator Elizabeth Warren (D-MA). Hillary Clinton also used Facebook for longer messages and imaging.
Notification Switch
Would you like to follow the 'American government' conversation and receive update notifications?

|
|

|
|

|
|

|
|

|
|

|
|

|
|
|
|
|

|
|

|