<< Chapter < Page Chapter >> Page >

Learning objectives

By the end of this section, you will be able to:

  • Identify factors that motivate registered voters to vote
  • Discuss circumstances that prevent citizens from voting
  • Analyze reasons for low voter turnout in the United States

Campaign managers worry about who will show up at the polls on Election Day. Will more Republicans come? More Democrats? Will a surge in younger voters occur this year, or will an older population cast ballots? We can actually predict with strong accuracy who is likely to vote each year, based on identified influence factors such as age, education, and income. Campaigns will often target each group of voters in different ways, spending precious campaign dollars on the groups already most likely to show up at the polls rather than trying to persuade citizens who are highly unlikely to vote.

Counting voters

Low voter turnout has long caused the media and others to express concern and frustration. A healthy democratic society is expected to be filled with citizens who vote regularly and participate in the electoral process. Organizations like Rock the Vote and Project Vote Smart ( [link] ) work alongside MTV to increase voter turnout in all age groups across the United States. But just how low is voter turnout? The answer depends on who is calculating it and how. There are several methods, each of which highlights a different problem with the electoral system in the United States.
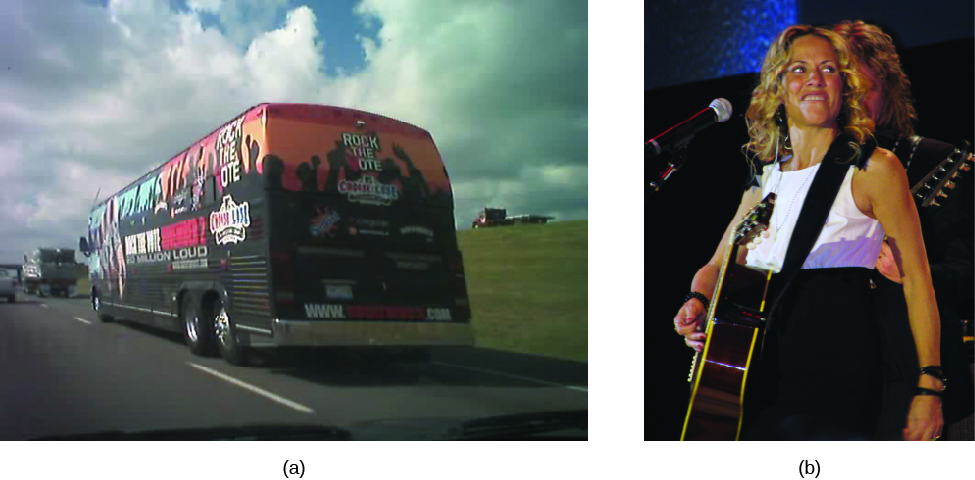
Image A is of a tour bus driving along a road. Print on the back of the bus reads “Rock the Vote”. Image B is of Sheryl Crow holding a guitar.
Rock the Vote works with musicians and other celebrities across the country to encourage and register young people to vote (a). Sheryl Crow was one of Rock the Vote’s strongest supporters in the 2008 election, subsequently performing at the Midwest Inaugural Ball in January 2009 (b). (credit a: modification of work by Jeff Kramer; credit b: modification of work by “cliff1066”/Flickr)

Calculating voter turnout begins by counting how many ballots were cast in a particular election. These votes must be cast on time, either by mail or in person. The next step is to count how many people could have voted in the same election. This is the number that causes different people to calculate different turnout rates. The complete population of the country includes all people, regardless of age, nationality, mental capacity, or freedom. We can count subsections of this population to calculate voter turnout. For instance, the next largest population in the country is the voting-age population    (VAP), which consists of persons who are eighteen and older. Some of these persons may not be eligible to vote in their state, but they are included because they are of age to do so.

Michael P. McDonald and Samuel Popkin. 2001. “Myth of the Vanishing Voter,” American Political Science Review 95, No. 4: 963–974; See also, “What is the Voting-Age Population (VAP) and the Voting-Eligible Population (VEP)?” http://www.electproject.org/home/voter-turnout/faq/denominator (November 12, 2015).

Questions & Answers

how do you get the 2/50
Abba Reply
number of sport play by 50 student construct discrete data
Aminu Reply
width of the frangebany leaves on how to write a introduction
Theresa Reply
Solve the mean of variance
Veronica Reply
Step 1: Find the mean. To find the mean, add up all the scores, then divide them by the number of scores. ... Step 2: Find each score's deviation from the mean. ... Step 3: Square each deviation from the mean. ... Step 4: Find the sum of squares. ... Step 5: Divide the sum of squares by n – 1 or N.
kenneth
what is error
Yakuba Reply
Is mistake done to something
Vutshila
Hy
anas
hy
What is the life teble
anas
hy
Jibrin
statistics is the analyzing of data
Tajudeen Reply
what is statics?
Zelalem Reply
how do you calculate mean
Gloria Reply
diveving the sum if all values
Shaynaynay
let A1,A2 and A3 events be independent,show that (A1)^c, (A2)^c and (A3)^c are independent?
Fisaye Reply
what is statistics
Akhisani Reply
data collected all over the world
Shaynaynay
construct a less than and more than table
Imad Reply
The sample of 16 students is taken. The average age in the sample was 22 years with astandard deviation of 6 years. Construct a 95% confidence interval for the age of the population.
Aschalew Reply
Bhartdarshan' is an internet-based travel agency wherein customer can see videos of the cities they plant to visit. The number of hits daily is a normally distributed random variable with a mean of 10,000 and a standard deviation of 2,400 a. what is the probability of getting more than 12,000 hits? b. what is the probability of getting fewer than 9,000 hits?
Akshay Reply
Bhartdarshan'is an internet-based travel agency wherein customer can see videos of the cities they plan to visit. The number of hits daily is a normally distributed random variable with a mean of 10,000 and a standard deviation of 2,400. a. What is the probability of getting more than 12,000 hits
Akshay
1
Bright
Sorry i want to learn more about this question
Bright
Someone help
Bright
a= 0.20233 b=0.3384
Sufiyan
a
Shaynaynay
How do I interpret level of significance?
Mohd Reply
It depends on your business problem or in Machine Learning you could use ROC- AUC cruve to decide the threshold value
Shivam
how skewness and kurtosis are used in statistics
Owen Reply
yes what is it
Taneeya
Got questions? Join the online conversation and get instant answers!
Jobilize.com Reply

Get Jobilize Job Search Mobile App in your pocket Now!

Get it on Google Play Download on the App Store Now


Source:  OpenStax, American government. OpenStax CNX. Dec 05, 2016 Download for free at http://cnx.org/content/col11995/1.15
Google Play and the Google Play logo are trademarks of Google Inc.

Notification Switch

Would you like to follow the 'American government' conversation and receive update notifications?

Ask