

| << Chapter < Page | Chapter >> Page > |
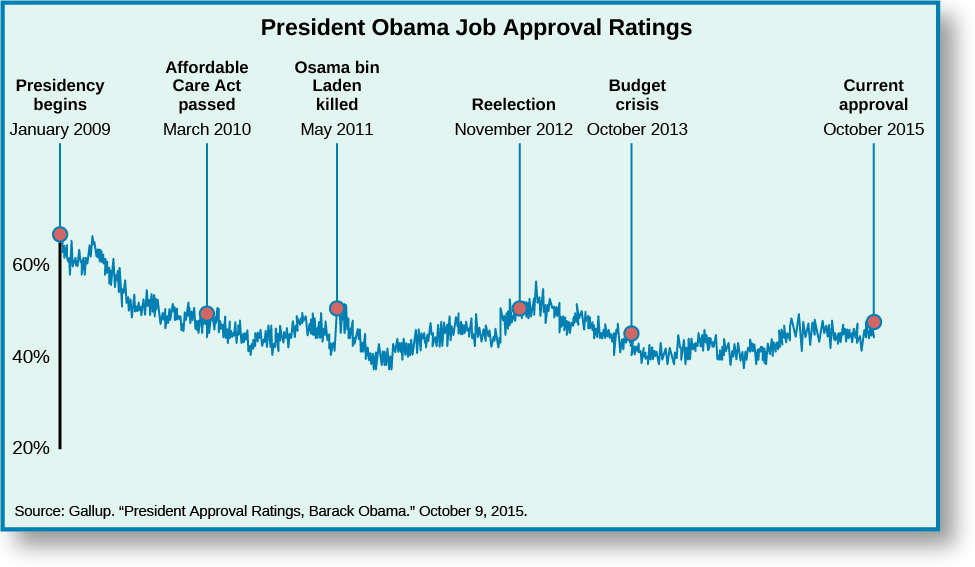
The president is the most visible member of the U.S. government and a lightning rod for disagreement. Presidents are often blamed for the decisions of their administrations and political parties, and are held accountable for economic and foreign policy downturns. For these reasons, they can expect their approval ratings to slowly decline over time, increasing or decreasing slightly with specific events. On average, presidents enjoy a 66 percent approval rating when starting office, but it drops to 53 percent by the end of the first term. Presidents serving a second term average a beginning approval rating of 55.5 percent, which falls to 47 percent by the end of office. President Obama’s presidency has followed the same trend. He entered office with a public approval rating of 67 percent, which fell to 54 percent by the third quarter, dropped to 52 percent after his reelection, and, as of August 2015, was at 46 percent ( [link] ).
Events during a president’s term may spike his or her public approval ratings. George W.
Bush ’s public approval rating jumped from 51 percent on September 10, 2001, to 86 percent by September 15 following the 9/11 attacks. His father, George H. W.
Bush , had received a similar spike in approval ratings (from 58 to 89 percent) following the end of the first Persian Gulf War in 1991.
Gallup. 2015. “Presidential Approval Ratings – George W. Bush.”
Gallup . June 20, 2015. http://www.gallup.com/poll/116500/Presidential-Approval-Ratings-George-Bush.aspx (February 18, 2016). These spikes rarely last more than a few weeks, so presidents try to quickly use the political capital they bring. For example, the 9/11 rally effect helped speed a congressional joint resolution authorizing the president to use troops, and the “global war on terror” became a reality.
115 STAT. 2001. “224. Public Law 107-40. Joint Resolution.” 107th Congress. http://www.gpo.gov/fdsys/pkg/PLAW-107publ40/pdf/PLAW-107publ40.pdf (February 18, 2016). The rally was short-lived, and support for the wars in Iraq and Afghanistan quickly deteriorated post-2003.
Pew Research Center. 2008. “Public Attitudes Towards the War in Iraq: 2003-2008.”
Pew Research Center . March 19, 2008. http://www.pewresearch.org/2008/03/19/public-attitudes-toward-the-war-in-iraq-20032008/ (February 18, 2016); Pew Research Center. 2014. “More Now See Failure than Success in Iraq, Afghanistan.”
Pew Research Center . January 30, 2014. http://www.people-press.org/2014/01/30/more-now-see-failure-than-success-in-iraq-afghanistan/ (February 18, 2016).
Some presidents have had higher or lower public approval than others, though ratings are difficult to compare, because national and world events that affect presidential ratings are outside a president’s control. Several chief executives presided over failing economies or wars, whereas others had the benefit of strong economies and peace. Gallup, however, gives an average approval rating for each president across the entire period served in office. George W. Bush’s average approval rating from 2001 to 2008 was 49.4 percent. Ronald
Reagan ’s from 1981 to 1988 was 52.8 percent, despite his winning all but thirteen electoral votes in his reelection bid. Bill
Clinton ’s average approval from 1993 to 2000 was 55.1 percent, including the months surrounding the Monica Lewinsky scandal and his subsequent impeachment. To compare other notable presidents, John F.
Kennedy averaged 70.1 percent and Richard
Nixon 49 percent.
Gallup. 2015. “Presidential Job Approval Center.”
Gallup . June 20, 2015. http://www.gallup.com/poll/124922/Presidential-Job-Approval-Center.aspx?utm_source=PRESIDENTIAL_JOB_APPROVAL&utm_medium=topic&utm_campaign=tiles (February 18, 2016). Kennedy’s average was unusually high because his time in office was short; he was assassinated before he could run for reelection, leaving less time for his ratings to decline. Nixon’s unusually low approval ratings reflect several months of media and congressional investigations into his involvement in the Watergate affair, as well as his resignation in the face of likely impeachment.
Notification Switch
Would you like to follow the 'American government' conversation and receive update notifications?

|
|

|
|

|
|

|
|

|
|

|
|

|
|

|
|
|
|
|
|
|