<< Chapter < Page Chapter >> Page >

Learning objectives

By the end of this section, you will be able to:

  • Describe the history of state legislative term limits
  • Compare the costs and benefits of term limits

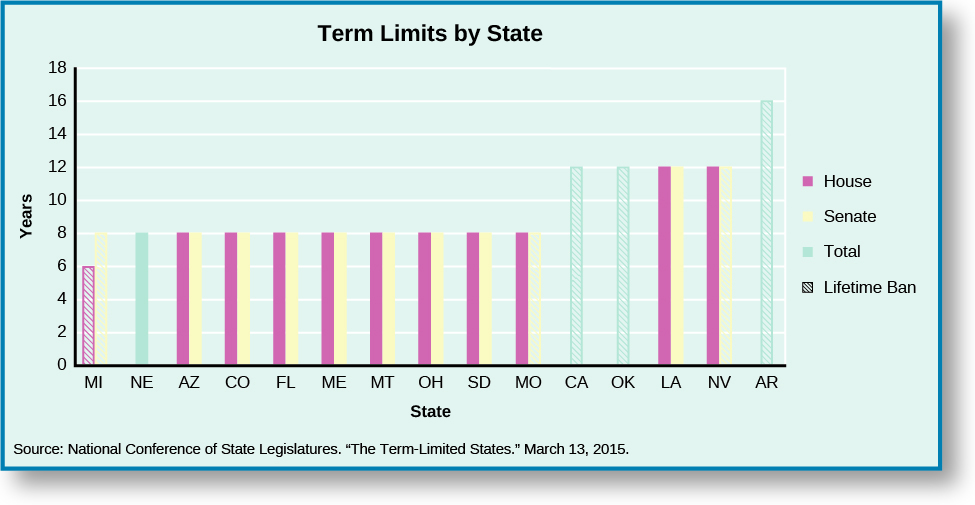
Term limits restrict the length of time a member can serve in the state legislature by capping either lifetime service or the number of consecutive terms. The term limits    movement gained momentum in the 1990s, spreading across a wide array of state legislative institutions. Today, fifteen states have imposed term limits on their state house and state senate members. On the other hand, six states, one as recently as 2004, have repealed the term limits imposed on them by the electorate, through either judicial action in the state Supreme Courts or through legislative action in the state legislature.

National Conference of State Legislatures. 13 March 2015. “The Term-Limited States,” http://www.ncsl.org/research/about-state-legislatures/chart-of-term-limits-states.aspx.

The basics of term limits

Under consecutive term limits    , a member can serve for only a specified period of time in either the state house or the state senate, most commonly eight years. To try to regain a seat in the legislature once the limit has been met, the member will have to wait to run for office again. If the member succeeds, the clock will reset and the legislator may once again serve up to the limit set by the state. In states with a lifetime ban    , such as Oklahoma, members can serve only one time for the number of years allotted, and they are not permitted to run for office again ( [link] ).

See note 65.

A graph titled “Term Limits by State”. The x-axis is labeled “State” and the y-axis is labeled “Years”. The graph has a legend with four categories marked “House”, “Senate,” “Total,” and “Lifetime Ban”. From left to right on the x-axis: “MI” has a ban of 6 years lifetime in the house, and 8 years total lifetime in the senate; “NE” has a ban of 8 years total; “AZ” has a ban of 8 years in the house, and 8 years in the senate; “CO” has a ban of 8 years in the house, and 8 years in the senate; “FL” has a ban of 8 years in the house, and 8 years in the senate; “ME” has a ban of 8 years in the house, and 8 years in the senate; “MT” has a ban of 8 years in the house, and 8 years in the senate; “OH” has a ban of 8 years in the house, and 8 years in the senate; “SD” has a ban of 8 years in the house, and 8 years in the senate; “MO” has a ban of 8 years in the house, and 8 years total lifetime in the senate; “CA” has a ban of 12 years lifetime; “OK” has a ban of 12 years lifetime; “LA” has a ban of 12 years in the house, and 12 years in the senate; “NV” has a ban of 12 years in the house, and 12 years total lifetime in the senate; “AR” has a ban of 16 years total lifetime.
Fifteen states currently have some form of term limits. This chart depicts which states have consecutive term limits or lifetime bans and how long a member can serve under each scenario.

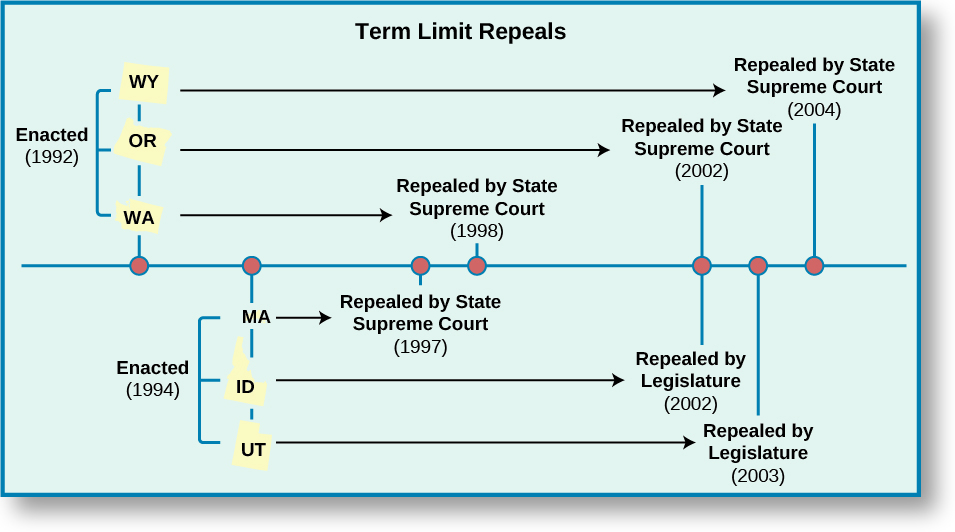
The first term limits were enacted in 1990 in California, Colorado, and Oklahoma. In 1992, eight more states followed suit in one large wave. The last state to enact term limits on legislative members was Nebraska in 2000.

See note 65.
However, term limits did not stay in effect in all these states; many state supreme courts repealed them and declared them unconstitutional for a variety of reasons ( [link] ). For instance, in Massachusetts and Washington, term limits were deemed unconstitutional because they affected candidate qualifications to compete for a given office. The courts ruled that changes to those qualifications could be made only by amending the state constitution, not by voters changing the state law.
National Conference of State Legislatures. “Term Limits and the Courts,” http://www.ncsl.org/research/about-state-legislatures/summaries-of-term-limits-cases.aspx (March 14, 2016).

A timeline chart titled “Term Limit Repeals”. A horizontal line stretches across the chart and is marked with seven points. The first point is labeled “Enacted (1992), WY, OR, WA”. An arrow points from “WA” to the fourth point on the timeline, labeled “Repealed by State Supreme Court (1998)”. An arrow points from “OR” to the fifth point on the timeline, labeled “Repealed by State Supreme Court (2002)”. An arrow points from “WA” to the seventh point on the timeline, labeled “Repealed by State Supreme Court (2004)”. The second point is labeled “Enacted (1994), MA, ID, UT”. An arrow points from “MA” to the third point on the timeline, labeled ““Repealed by State Supreme Court (1997)”. An arrow points from “ID” to the fifth point on the timeline, labeled “Repealed by Legislature (2002)”. An arrow points from “UT” to the sixth point on the timeline, labeled “Repealed by Legislature (2003)”.
A number of states have tried to enact term limits on members of the legislature only to see the laws later repealed by the state legislature or ruled unconstitutional by the state supreme court.

Advantages of term limits

In many cases, the movement to institute term limits was initiated by voters and passed through citizen initiatives, which allow citizens to place a proposed law or constitutional amendment on the ballot for a popular vote.

National Conference of State Legislatures. 20 September 2012. “Initiative, Referendum and Recall,” http://www.ncsl.org/research/elections-and-campaigns/initiative-referendum-and-recall-overview.aspx.
Proponents of term limits felt new blood was needed in state legislatures to bring fresh ideas and perspectives to lawmaking. In addition, they hoped term limits would compel turnover among members by shortening the time anyone could serve and by reducing the tendency for elected officials to make legislative service their career. In conjunction with this thinking, some supporters hoped term limits would increase the motivation to make good public policy. If members were less focused on reelection and knew they could not serve more than a certain number of years, perhaps they would get right down to the business of making laws and produce innovative policy within a narrow window of time.
John Carey, Richard Niemi, and Lynda Powell. 2000. Term Limits in State Legislatures . Ann Arbor: University of Michigan Press.

Questions & Answers

differentiate between demand and supply giving examples
Lambiv Reply
differentiated between demand and supply using examples
Lambiv
what is labour ?
Lambiv
how will I do?
Venny Reply
how is the graph works?I don't fully understand
Rezat Reply
information
Eliyee
devaluation
Eliyee
t
WARKISA
hi guys good evening to all
Lambiv
multiple choice question
Aster Reply
appreciation
Eliyee
explain perfect market
Lindiwe Reply
In economics, a perfect market refers to a theoretical construct where all participants have perfect information, goods are homogenous, there are no barriers to entry or exit, and prices are determined solely by supply and demand. It's an idealized model used for analysis,
Ezea
What is ceteris paribus?
Shukri Reply
other things being equal
AI-Robot
When MP₁ becomes negative, TP start to decline. Extuples Suppose that the short-run production function of certain cut-flower firm is given by: Q=4KL-0.6K2 - 0.112 • Where is quantity of cut flower produced, I is labour input and K is fixed capital input (K-5). Determine the average product of lab
Kelo
Extuples Suppose that the short-run production function of certain cut-flower firm is given by: Q=4KL-0.6K2 - 0.112 • Where is quantity of cut flower produced, I is labour input and K is fixed capital input (K-5). Determine the average product of labour (APL) and marginal product of labour (MPL)
Kelo
yes,thank you
Shukri
Can I ask you other question?
Shukri
what is monopoly mean?
Habtamu Reply
What is different between quantity demand and demand?
Shukri Reply
Quantity demanded refers to the specific amount of a good or service that consumers are willing and able to purchase at a give price and within a specific time period. Demand, on the other hand, is a broader concept that encompasses the entire relationship between price and quantity demanded
Ezea
ok
Shukri
how do you save a country economic situation when it's falling apart
Lilia Reply
what is the difference between economic growth and development
Fiker Reply
Economic growth as an increase in the production and consumption of goods and services within an economy.but Economic development as a broader concept that encompasses not only economic growth but also social & human well being.
Shukri
production function means
Jabir
What do you think is more important to focus on when considering inequality ?
Abdisa Reply
any question about economics?
Awais Reply
sir...I just want to ask one question... Define the term contract curve? if you are free please help me to find this answer 🙏
Asui
it is a curve that we get after connecting the pareto optimal combinations of two consumers after their mutually beneficial trade offs
Awais
thank you so much 👍 sir
Asui
In economics, the contract curve refers to the set of points in an Edgeworth box diagram where both parties involved in a trade cannot be made better off without making one of them worse off. It represents the Pareto efficient allocations of goods between two individuals or entities, where neither p
Cornelius
In economics, the contract curve refers to the set of points in an Edgeworth box diagram where both parties involved in a trade cannot be made better off without making one of them worse off. It represents the Pareto efficient allocations of goods between two individuals or entities,
Cornelius
Suppose a consumer consuming two commodities X and Y has The following utility function u=X0.4 Y0.6. If the price of the X and Y are 2 and 3 respectively and income Constraint is birr 50. A,Calculate quantities of x and y which maximize utility. B,Calculate value of Lagrange multiplier. C,Calculate quantities of X and Y consumed with a given price. D,alculate optimum level of output .
Feyisa Reply
Answer
Feyisa
c
Jabir
the market for lemon has 10 potential consumers, each having an individual demand curve p=101-10Qi, where p is price in dollar's per cup and Qi is the number of cups demanded per week by the i th consumer.Find the market demand curve using algebra. Draw an individual demand curve and the market dema
Gsbwnw Reply
suppose the production function is given by ( L, K)=L¼K¾.assuming capital is fixed find APL and MPL. consider the following short run production function:Q=6L²-0.4L³ a) find the value of L that maximizes output b)find the value of L that maximizes marginal product
Abdureman
types of unemployment
Yomi Reply
What is the difference between perfect competition and monopolistic competition?
Mohammed
Got questions? Join the online conversation and get instant answers!
Jobilize.com Reply

Get Jobilize Job Search Mobile App in your pocket Now!

Get it on Google Play Download on the App Store Now


Source:  OpenStax, American government. OpenStax CNX. Dec 05, 2016 Download for free at http://cnx.org/content/col11995/1.15
Google Play and the Google Play logo are trademarks of Google Inc.

Notification Switch

Would you like to follow the 'American government' conversation and receive update notifications?

Ask