

| << Chapter < Page | Chapter >> Page > |
The national saving and investment identity must always hold true because, by definition, the quantity supplied and quantity demanded in the financial capital market must always be equal. However, the formula will look somewhat different if the government budget is in deficit rather than surplus or if the balance of trade is in surplus rather than deficit . For example, in 1999 and 2000, the U.S. government had budget surpluses, although the economy was still experiencing trade deficits. When the government was running budget surpluses, it was acting as a saver rather than a borrower, and supplying rather than demanding financial capital. As a result, the national saving and investment identity during this time would be more properly written:
Let's call this equation 3. Notice that this expression is mathematically the same as equation 2 except the savings and investment sides of the identity have simply flipped sides.
During the 1960s, the U.S. government was often running a budget deficit, but the economy was typically running trade surpluses. Since a trade surplus means that an economy is experiencing a net outflow of financial capital, the national saving and investment identity would be written:
Instead of the balance of trade representing part of the supply of financial capital, which occurs with a trade deficit, a trade surplus represents an outflow of financial capital leaving the domestic economy and being invested elsewhere in the world.
The point to this parade of equations is that the national saving and investment identity is assumed to always hold. So when you write these relationships, it is important to engage your brain and think about what is on the supply side and what is on the demand side of the financial capital market before you put pencil to paper.
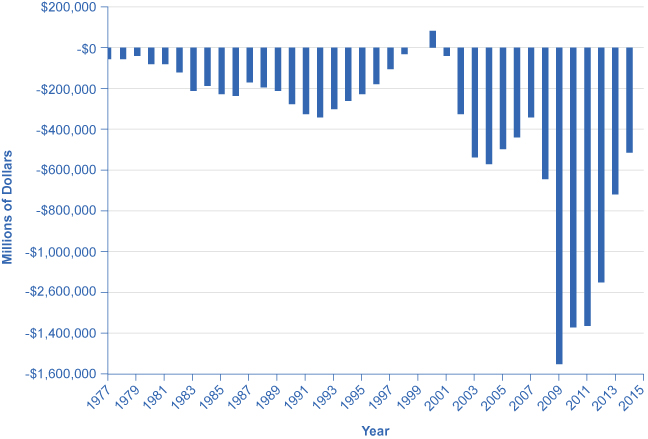
As can be seen in [link] , the Office of Management and Budget shows that the United States has consistently run budget deficits since 1977, with the exception of 1999 and 2000. What is alarming is the dramatic increase in budget deficits that has occurred since 2008, which in part reflects declining tax revenues and increased safety net expenditures due to the Great Recession. (Recall that T is net taxes. When the government must transfer funds back to individuals for safety net expenditures like Social Security and unemployment benefits, budget deficits rise.) These deficits have implications for the future health of the U.S. economy.
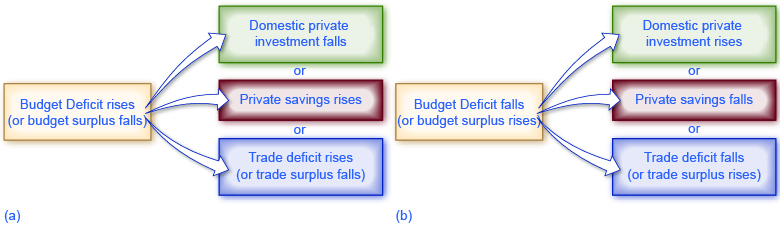
A rising budget deficit may result in a fall in domestic investment, a rise in private savings, or a rise in the trade deficit. The following modules discuss each of these possible effects in more detail.
A change in any part of the national saving and investment identity suggests that if the government budget deficit changes, then either private savings, private investment in physical capital, or the trade balance—or some combination of the three—must change as well.
Notification Switch
Would you like to follow the 'Principles of economics' conversation and receive update notifications?

|
|
|
|
|

|
|

|
|

|
|

|
|

|
|

|
|

|
|

|
|

|
|

|