<< Chapter < Page Chapter >> Page >

A glance back at economic history provides a second illustration of the power of automatic stabilizers. Remember that the length of economic upswings between recessions has become longer in the U.S. economy in recent decades (as discussed in Unemployment ). The three longest economic booms of the twentieth century happened in the 1960s, the 1980s, and the 1991–2001 time period. One reason why the economy has tipped into recession less frequently in recent decades is that the size of government spending and taxes has increased in the second half of the twentieth century. Thus, the automatic stabilizing effects from spending and taxes are now larger than they were in the first half of the twentieth century. Around 1900, for example, federal spending was only about 2% of GDP. In 1929, just before the Great Depression hit, government spending was still just 4% of GDP. In those earlier times, the smaller size of government made automatic stabilizers far less powerful than in the last few decades, when government spending often hovers at 20% of GDP or more.

The standardized employment deficit or surplus

Each year, the nonpartisan Congressional Budget Office (CBO) calculates the standardized employment budget    —that is, what the budget deficit or surplus would be if the economy were producing at potential GDP, where people who look for work were finding jobs in a reasonable period of time and businesses were making normal profits, with the result that both workers and businesses would be earning more and paying more taxes. In effect, the standardized employment deficit eliminates the impact of the automatic stabilizers. [link] compares the actual budget deficits of recent decades with the CBO’s standardized deficit.

Visit this website to learn more from the Congressional Budget Office.

Comparison of actual budget deficits with the standardized employment deficit

The graph shows how the standardized deficit surplus and the actual deficit surplus have changed since 1970. Both lines tend to rise and fall at similar times. The only time both were positive numbers was between the mid-1990s and early 2000s. As of 2014, both standardized deficit surplus and actual deficit surplus had dropped to their lowest amount, both below –6%.
When the economy is in recession, the standardized employment budget deficit is less than the actual budget deficit because the economy is below potential GDP, and the automatic stabilizers are reducing taxes and increasing spending. When the economy is performing extremely well, the standardized employment deficit (or surplus) is higher than the actual budget deficit (or surplus) because the economy is producing about potential GDP, so the automatic stabilizers are increasing taxes and reducing the need for government spending. (Sources: Actual and Cyclically Adjusted Budget Surpluses/Deficits, http://www.cbo.gov/publication/43977; and Economic Report of the President, Table B-1, http://www.gpo.gov/fdsys/pkg/ERP-2013/content-detail.html)

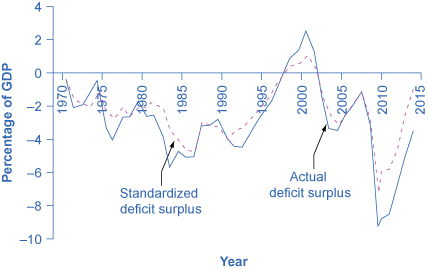
Notice that in recession years, like the early 1990s, 2001, or 2009, the standardized employment deficit is smaller than the actual deficit. During recessions, the automatic stabilizers tend to increase the budget deficit, so if the economy was instead at full employment, the deficit would be reduced. However, in the late 1990s the standardized employment budget surplus was lower than the actual budget surplus. The gap between the standardized budget deficit or surplus and the actual budget deficit or surplus shows the impact of the automatic stabilizers. More generally, the standardized budget figures allow you to see what the budget deficit would look like with the economy held constant—at its potential GDP level of output.

Automatic stabilizers occur quickly. Lower wages means that a lower amount of taxes is withheld from paychecks right away. Higher unemployment or poverty means that government spending in those areas rises as quickly as people apply for benefits. However, while the automatic stabilizers offset part of the shifts in aggregate demand, they do not offset all or even most of it. Historically, automatic stabilizers on the tax and spending side offset about 10% of any initial movement in the level of output. This offset may not seem enormous, but it is still useful. Automatic stabilizers, like shock absorbers in a car, can be useful if they reduce the impact of the worst bumps, even if they do not eliminate the bumps altogether.

Key concepts and summary

Fiscal policy is conducted both through discretionary fiscal policy, which occurs when the government enacts taxation or spending changes in response to economic events, or through automatic stabilizers, which are taxing and spending mechanisms that, by their design, shift in response to economic events without any further legislation. The standardized employment budget is the calculation of what the budget deficit or budget surplus would have been in a given year if the economy had been producing at its potential GDP in that year. Many economists and politicians criticize the use of fiscal policy for a variety of reasons, including concerns over time lags, the impact on interest rates, and the inherently political nature of fiscal policy. We cover the critique of fiscal policy in the next module.

Questions & Answers

What are the factors that affect demand for a commodity
Florence Reply
differentiate between demand and supply giving examples
Lambiv Reply
differentiated between demand and supply using examples
Lambiv
what is labour ?
Lambiv
how will I do?
Venny Reply
how is the graph works?I don't fully understand
Rezat Reply
information
Eliyee
devaluation
Eliyee
t
WARKISA
hi guys good evening to all
Lambiv
multiple choice question
Aster Reply
appreciation
Eliyee
explain perfect market
Lindiwe Reply
In economics, a perfect market refers to a theoretical construct where all participants have perfect information, goods are homogenous, there are no barriers to entry or exit, and prices are determined solely by supply and demand. It's an idealized model used for analysis,
Ezea
What is ceteris paribus?
Shukri Reply
other things being equal
AI-Robot
When MP₁ becomes negative, TP start to decline. Extuples Suppose that the short-run production function of certain cut-flower firm is given by: Q=4KL-0.6K2 - 0.112 • Where is quantity of cut flower produced, I is labour input and K is fixed capital input (K-5). Determine the average product of lab
Kelo
Extuples Suppose that the short-run production function of certain cut-flower firm is given by: Q=4KL-0.6K2 - 0.112 • Where is quantity of cut flower produced, I is labour input and K is fixed capital input (K-5). Determine the average product of labour (APL) and marginal product of labour (MPL)
Kelo
yes,thank you
Shukri
Can I ask you other question?
Shukri
what is monopoly mean?
Habtamu Reply
What is different between quantity demand and demand?
Shukri Reply
Quantity demanded refers to the specific amount of a good or service that consumers are willing and able to purchase at a give price and within a specific time period. Demand, on the other hand, is a broader concept that encompasses the entire relationship between price and quantity demanded
Ezea
ok
Shukri
how do you save a country economic situation when it's falling apart
Lilia Reply
what is the difference between economic growth and development
Fiker Reply
Economic growth as an increase in the production and consumption of goods and services within an economy.but Economic development as a broader concept that encompasses not only economic growth but also social & human well being.
Shukri
production function means
Jabir
What do you think is more important to focus on when considering inequality ?
Abdisa Reply
any question about economics?
Awais Reply
sir...I just want to ask one question... Define the term contract curve? if you are free please help me to find this answer 🙏
Asui
it is a curve that we get after connecting the pareto optimal combinations of two consumers after their mutually beneficial trade offs
Awais
thank you so much 👍 sir
Asui
In economics, the contract curve refers to the set of points in an Edgeworth box diagram where both parties involved in a trade cannot be made better off without making one of them worse off. It represents the Pareto efficient allocations of goods between two individuals or entities, where neither p
Cornelius
In economics, the contract curve refers to the set of points in an Edgeworth box diagram where both parties involved in a trade cannot be made better off without making one of them worse off. It represents the Pareto efficient allocations of goods between two individuals or entities,
Cornelius
Suppose a consumer consuming two commodities X and Y has The following utility function u=X0.4 Y0.6. If the price of the X and Y are 2 and 3 respectively and income Constraint is birr 50. A,Calculate quantities of x and y which maximize utility. B,Calculate value of Lagrange multiplier. C,Calculate quantities of X and Y consumed with a given price. D,alculate optimum level of output .
Feyisa Reply
Answer
Feyisa
c
Jabir
the market for lemon has 10 potential consumers, each having an individual demand curve p=101-10Qi, where p is price in dollar's per cup and Qi is the number of cups demanded per week by the i th consumer.Find the market demand curve using algebra. Draw an individual demand curve and the market dema
Gsbwnw Reply
suppose the production function is given by ( L, K)=L¼K¾.assuming capital is fixed find APL and MPL. consider the following short run production function:Q=6L²-0.4L³ a) find the value of L that maximizes output b)find the value of L that maximizes marginal product
Abdureman

Get Jobilize Job Search Mobile App in your pocket Now!

Get it on Google Play Download on the App Store Now


Source:  OpenStax, Principles of economics. OpenStax CNX. Sep 19, 2014 Download for free at http://legacy.cnx.org/content/col11613/1.11
Google Play and the Google Play logo are trademarks of Google Inc.

Notification Switch

Would you like to follow the 'Principles of economics' conversation and receive update notifications?

Ask