<< Chapter < Page Chapter >> Page >

Productivity growth since 1950

The chart shows productivity growth for various time periods. For 1950 to 1970 it was 2.5%; 1971 to 1990 was about 1.3%; 1991 to 2000 was 2.2%; and 2001 to 2014 was 2.1%.
U.S. growth in worker productivity was very high between 1950 and 1970. It then declined to lower levels in the 1970s and the 1980s. The late 1990s and early 2000s saw productivity rebound, but then productivity sagged a bit in the 2000s. Some think the productivity rebound of the late 1990s and early 2000s marks the start of a “new economy” built on higher productivity growth, but this cannot be determined until more time has passed. (Source: U.S. Department of Labor, Bureau of Labor Statistics.)

The “new economy” controversy

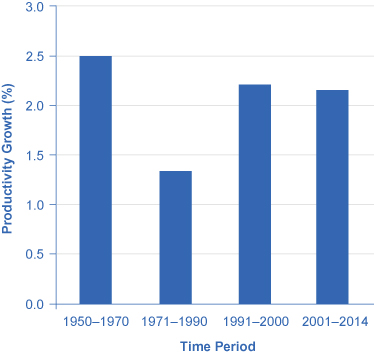
In recent years a controversy has been brewing among economists about the resurgence of U.S. productivity in the second half of the 1990s. One school of thought argues that the United States had developed a “new economy” based on the extraordinary advances in communications and information technology of the 1990s. The most optimistic proponents argue that it would generate higher average productivity growth for decades to come. The pessimists, on the other hand, argue that even five or ten years of stronger productivity growth does not prove that higher productivity will last for the long term. It is hard to infer anything about long-term productivity trends during the later part of the 2000s, because the steep recession of 2008–2009, with its sharp but not completely synchronized declines in output and employment, complicates any interpretation. While productivity growth was high in 2009 and 2010 (around 3%), it has slowed down since then.

Productivity growth is also closely linked to the average level of wages. Over time, the amount that firms are willing to pay workers will depend on the value of the output those workers produce. If a few employers tried to pay their workers less than what those workers produced, then those workers would receive offers of higher wages from other profit-seeking employers. If a few employers mistakenly paid their workers more than what those workers produced, those employers would soon end up with losses. In the long run, productivity per hour is the most important determinant of the average wage level in any economy. To learn how to compare economies in this regard, follow the steps in the following Work It Out feature.

Comparing the economies of two countries

The Organization for Economic Co-operation and Development (OECD) tracks data on the annual growth rate of real GDP per hour worked. You can find these data on the OECD data webpage “Labour productivity growth in the total economy” at this website.

Step 1. Visit the OECD website given above and select two countries to compare.

Step 2. On the drop-down menu “Variable,” select “Real GDP, Annual Growth, in percent” and record the data for the countries you have chosen for the five most recent years.

Step 3. Go back to the drop-down menu and select “Real GDP per Hour Worked, Annual Growth Rate, in percent” and select data for the same years for which you selected GDP data.

Step 4. Compare real GDP growth for both countries. [link] provides an example of a comparison between Australia and Belgium.

Australia 2009 2010 2011 2012 2013
Real GDP Growth (%) 0.1% 1.0% 2.2% 0.8 0.7%
Real GDP Growth/Hours Worked (%) 1.9% –0.3% 2.4% 3.3% 1.4%
Belgium 2009 2010 2011 2012 2013
Real GDP Growth (%) –3.4 1.6 0.8 –0.6 –0.2
Real GDP Growth/Hours Worked (%) –1.3 –1.4 –0.5 –0.3 0.3

Step 5. Consider the many factors can affect growth. For example, one factor that may have affected Australia is its isolation from Europe, which may have insulated the country from the effects of the global recession. In Belgium’s case, the global recession seems to have had an impact on both GDP and real GDP per hours worked between 2009 and 2013, though productivity does seem to be recovering.

Questions & Answers

A golfer on a fairway is 70 m away from the green, which sits below the level of the fairway by 20 m. If the golfer hits the ball at an angle of 40° with an initial speed of 20 m/s, how close to the green does she come?
Aislinn Reply
cm
tijani
what is titration
John Reply
what is physics
Siyaka Reply
A mouse of mass 200 g falls 100 m down a vertical mine shaft and lands at the bottom with a speed of 8.0 m/s. During its fall, how much work is done on the mouse by air resistance
Jude Reply
Can you compute that for me. Ty
Jude
what is the dimension formula of energy?
David Reply
what is viscosity?
David
what is inorganic
emma Reply
what is chemistry
Youesf Reply
what is inorganic
emma
Chemistry is a branch of science that deals with the study of matter,it composition,it structure and the changes it undergoes
Adjei
please, I'm a physics student and I need help in physics
Adjanou
chemistry could also be understood like the sexual attraction/repulsion of the male and female elements. the reaction varies depending on the energy differences of each given gender. + masculine -female.
Pedro
A ball is thrown straight up.it passes a 2.0m high window 7.50 m off the ground on it path up and takes 1.30 s to go past the window.what was the ball initial velocity
Krampah Reply
2. A sled plus passenger with total mass 50 kg is pulled 20 m across the snow (0.20) at constant velocity by a force directed 25° above the horizontal. Calculate (a) the work of the applied force, (b) the work of friction, and (c) the total work.
Sahid Reply
you have been hired as an espert witness in a court case involving an automobile accident. the accident involved car A of mass 1500kg which crashed into stationary car B of mass 1100kg. the driver of car A applied his brakes 15 m before he skidded and crashed into car B. after the collision, car A s
Samuel Reply
can someone explain to me, an ignorant high school student, why the trend of the graph doesn't follow the fact that the higher frequency a sound wave is, the more power it is, hence, making me think the phons output would follow this general trend?
Joseph Reply
Nevermind i just realied that the graph is the phons output for a person with normal hearing and not just the phons output of the sound waves power, I should read the entire thing next time
Joseph
Follow up question, does anyone know where I can find a graph that accuretly depicts the actual relative "power" output of sound over its frequency instead of just humans hearing
Joseph
"Generation of electrical energy from sound energy | IEEE Conference Publication | IEEE Xplore" ***ieeexplore.ieee.org/document/7150687?reload=true
Ryan
what's motion
Maurice Reply
what are the types of wave
Maurice
answer
Magreth
progressive wave
Magreth
hello friend how are you
Muhammad Reply
fine, how about you?
Mohammed
hi
Mujahid
A string is 3.00 m long with a mass of 5.00 g. The string is held taut with a tension of 500.00 N applied to the string. A pulse is sent down the string. How long does it take the pulse to travel the 3.00 m of the string?
yasuo Reply
Who can show me the full solution in this problem?
Reofrir Reply
Got questions? Join the online conversation and get instant answers!
Jobilize.com Reply

Get Jobilize Job Search Mobile App in your pocket Now!

Get it on Google Play Download on the App Store Now


Source:  OpenStax, Principles of economics. OpenStax CNX. Sep 19, 2014 Download for free at http://legacy.cnx.org/content/col11613/1.11
Google Play and the Google Play logo are trademarks of Google Inc.

Notification Switch

Would you like to follow the 'Principles of economics' conversation and receive update notifications?

Ask