<< Chapter < Page Chapter >> Page >

U.s. budget deficits/surpluses and private investment

The graph shows that in the case of the United States, since 1980 government borrowing and private investment have often risen and fallen in tandem. The y-axis shows U.S. government deficits/surpluses and private investment as a portion of GDP. The x-axis plots years from 1980 to 2014. It suggests that reduced government borrowing can free up capital for private investment.
The connection between private savings and flows of international capital plays a role in budget deficits and surpluses. Consequently, government borrowing and private investment sometimes rise and fall together. For example, the 1990s show a pattern in which reduced government borrowing helped to reduce crowding out so that more funds were available for private investment.

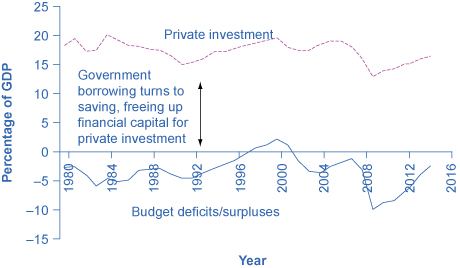
This argument does not claim that a government's budget deficits will exactly shadow its national rate of private investment; after all, private saving and inflows of foreign financial investment must also be taken into account. In the mid-1980s, for example, government budget deficits increased substantially without a corresponding drop off in private investment. In 2009, nonresidential private fixed investment dropped by $300 billion from its previous level of $1,941 billion in 2008, primarily because, during a recession, firms lack both the funds and the incentive to invest. Investment growth between 2009 and 2014 averaged approximately 5.9% to $2,210.5 billion—only slightly above its 2008 level, according to the Bureau of Economic Analysis. During that same period, interest rates dropped from 3.94% to less than a quarter percent as the Federal Reserve took dramatic action to prevent a depression by increasing the money supply through lowering short-term interest rates. The "crowding out" of private investment due to government borrowing to finance expenditures appears to have been suspended during the Great Recession. However, as the economy improves and interest rates rise, borrowing by the government may potentially create pressure on interest rates.

The interest rate connection

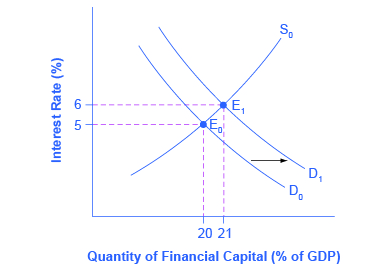
Assume that government borrowing of substantial amounts will have an effect on the quantity of private investment. How will this affect interest rates in financial markets? In [link] , the original equilibrium (E 0 ) where the demand curve    (D 0 ) for financial capital intersects with the supply curve    (S 0 ) occurs at an interest rate of 5% and an equilibrium quantity equal to 20% of GDP. However, as the government budget deficit increases, the demand curve for financial capital shifts from D 0 to D 1 . The new equilibrium (E 1 ) occurs at an interest rate of 6% and an equilibrium quantity of 21% of GDP.

Budget deficits and interest rates

The graph plots the downward-sloping demand and upward-sloping supply of financial capital. The y-axis is the interest rate (also known as the “price” of financial capital) and the x-axis shows the quantity of financial capital as a percentage of GDP. An increase in government borrowing increases the quantity of financial capital demanded at all interest rates. This is a rightward shift in the demand for financial capital. The graph shows that the equilibrium interest rate will rise.
In the financial market, an increase in government borrowing can shift the demand curve for financial capital to the right from D 0 to D 1 . As the equilibrium interest rate shifts from E 0 to E 1 , the interest rate rises from 5% to 6% in this example. The higher interest rate is one economic mechanism by which government borrowing can crowd out private investment.

A survey of economic studies on the connection between government borrowing and interest rates in the U.S. economy suggests that an increase of 1% in the budget deficit will lead to a rise in interest rates of between 0.5 and 1.0%, other factors held equal. In turn, a higher interest rate tends to discourage firms from making physical capital investments. One reason government budget deficits crowd out private investment, therefore, is the increase in interest rates. There are, however, economic studies that show a limited connection between the two (at least in the United States), but as the budget deficit grows, the dangers of rising interest rates become more real.

Questions & Answers

Ayele, K., 2003. Introductory Economics, 3rd ed., Addis Ababa.
Widad Reply
can you send the book attached ?
Ariel
?
Ariel
What is economics
Widad Reply
the study of how humans make choices under conditions of scarcity
AI-Robot
U(x,y) = (x×y)1/2 find mu of x for y
Desalegn Reply
U(x,y) = (x×y)1/2 find mu of x for y
Desalegn
what is ecnomics
Jan Reply
this is the study of how the society manages it's scarce resources
Belonwu
what is macroeconomic
John Reply
macroeconomic is the branch of economics which studies actions, scale, activities and behaviour of the aggregate economy as a whole.
husaini
etc
husaini
difference between firm and industry
husaini Reply
what's the difference between a firm and an industry
Abdul
firm is the unit which transform inputs to output where as industry contain combination of firms with similar production 😅😅
Abdulraufu
Suppose the demand function that a firm faces shifted from Qd  120 3P to Qd  90  3P and the supply function has shifted from QS  20  2P to QS 10  2P . a) Find the effect of this change on price and quantity. b) Which of the changes in demand and supply is higher?
Toofiq Reply
explain standard reason why economic is a science
innocent Reply
factors influencing supply
Petrus Reply
what is economic.
Milan Reply
scares means__________________ends resources. unlimited
Jan
economics is a science that studies human behaviour as a relationship b/w ends and scares means which have alternative uses
Jan
calculate the profit maximizing for demand and supply
Zarshad Reply
Why qualify 28 supplies
Milan
what are explicit costs
Nomsa Reply
out-of-pocket costs for a firm, for example, payments for wages and salaries, rent, or materials
AI-Robot
concepts of supply in microeconomics
David Reply
economic overview notes
Amahle Reply
identify a demand and a supply curve
Salome Reply
i don't know
Parul
there's a difference
Aryan
Demand curve shows that how supply and others conditions affect on demand of a particular thing and what percent demand increase whith increase of supply of goods
Israr
Hi Sir please how do u calculate Cross elastic demand and income elastic demand?
Abari
Got questions? Join the online conversation and get instant answers!
Jobilize.com Reply

Get Jobilize Job Search Mobile App in your pocket Now!

Get it on Google Play Download on the App Store Now


Source:  OpenStax, Principles of economics. OpenStax CNX. Sep 19, 2014 Download for free at http://legacy.cnx.org/content/col11613/1.11
Google Play and the Google Play logo are trademarks of Google Inc.

Notification Switch

Would you like to follow the 'Principles of economics' conversation and receive update notifications?

Ask