

| << Chapter < Page | Chapter >> Page > |
The economics approach portrays people as self-interested. For some critics of this approach, even if self-interest is an accurate description of how people behave, these behaviors are not moral. Instead, the critics argue that people should be taught to care more deeply about others. Economists offer several answers to these concerns.
First, economics is not a form of moral instruction. Rather, it seeks to describe economic behavior as it actually exists. Philosophers draw a distinction between positive statements , which describe the world as it is, and normative statements , which describe how the world should be. For example, an economist could analyze a proposed subway system in a certain city. If the expected benefits exceed the costs, he concludes that the project is worth doing—an example of positive analysis. Another economist argues for extended unemployment compensation during the Great Depression because a rich country like the United States should take care of its less fortunate citizens—an example of normative analysis.
Even if the line between positive and normative statements is not always crystal clear, economic analysis does try to remain rooted in the study of the actual people who inhabit the actual economy. Fortunately however, the assumption that individuals are purely self-interested is a simplification about human nature. In fact, we need to look no further than to Adam Smith , the very father of modern economics to find evidence of this. The opening sentence of his book, The Theory of Moral Sentiments , puts it very clearly: “How selfish soever man may be supposed, there are evidently some principles in his nature, which interest him in the fortune of others, and render their happiness necessary to him, though he derives nothing from it except the pleasure of seeing it.” Clearly, individuals are both self-interested and altruistic.
Second, self-interested behavior and profit-seeking can be labeled with other names, such as personal choice and freedom. The ability to make personal choices about buying, working, and saving is an important personal freedom. Some people may choose high-pressure, high-paying jobs so that they can earn and spend a lot of money on themselves. Others may earn a lot of money and give it to charity or spend it on their friends and family. Others may devote themselves to a career that can require a great deal of time, energy, and expertise but does not offer high financial rewards, like being an elementary school teacher or a social worker. Still others may choose a job that does not take lots of their time or provide a high level of income, but still leaves time for family, friends, and contemplation. Some people may prefer to work for a large company; others might want to start their own business. People’s freedom to make their own economic choices has a moral value worth respecting.
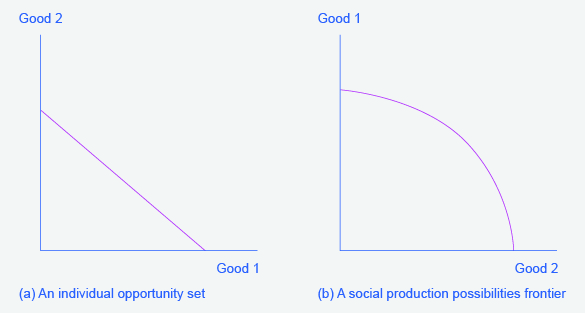
When you study economics, you may feel buried under an avalanche of diagrams: diagrams in the text, diagrams in the lectures, diagrams in the problems, and diagrams on exams. Your goal should be to recognize the common underlying logic and pattern of the diagrams, not to memorize each of the individual diagrams.
This chapter uses only one basic diagram, although it is presented with different sets of labels. The consumption budget constraint and the production possibilities frontier for society, as a whole, are the same basic diagram. [link] shows an individual budget constraint and a production possibilities frontier for two goods, Good 1 and Good 2. The tradeoff diagram always illustrates three basic themes: scarcity, tradeoffs, and economic efficiency.
The first theme is scarcity . It is not feasible to have unlimited amounts of both goods. But even if the budget constraint or a PPF shifts, scarcity remains—just at a different level. The second theme is tradeoffs . As depicted in the budget constraint or the production possibilities frontier, it is necessary to give up some of one good to gain more of the other good. The details of this tradeoff vary. In a budget constraint, the tradeoff is determined by the relative prices of the goods: that is, the relative price of two goods in the consumption choice budget constraint. These tradeoffs appear as a straight line. However, the tradeoffs in many production possibilities frontiers are represented by a curved line because the law of diminishing returns holds that as resources are added to an area, the marginal gains tend to diminish. Regardless of the specific shape, tradeoffs remain.
The third theme is economic efficiency , or getting the most benefit from scarce resources. All choices on the production possibilities frontier show productive efficiency because in such cases, there is no way to increase the quantity of one good without decreasing the quantity of the other. Similarly, when an individual makes a choice along a budget constraint, there is no way to increase the quantity of one good without decreasing the quantity of the other. The choice on a production possibilities set that is socially preferred, or the choice on an individual’s budget constraint that is personally preferred, will display allocative efficiency.
The basic budget constraint/production possibilities frontier diagram will recur throughout this book. Some examples include using these tradeoff diagrams to analyze trade, labor supply versus leisure, saving versus consumption, environmental protection and economic output, equality of incomes and economic output, and the macroeconomic tradeoff between consumption and investment. Do not be confused by the different labels. The budget constraint/production possibilities frontier diagram is always just a tool for thinking carefully about scarcity, tradeoffs, and efficiency in a particular situation.
Notification Switch
Would you like to follow the 'Principles of economics' conversation and receive update notifications?

|
|
|
|
|

|
|

|
|

|
|

|
|

|
|

|
|

|
|

|
|

|
|

|